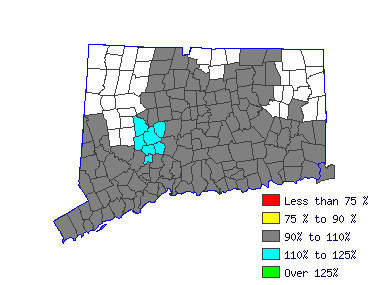
| New Haven LMA (1Q 2016) |
| All Industry |
| Estimated employment | 3,040 |
| Mean wage | $74,667 |
| Entry wage | $48,858 |
| 10th percentile wage | $44,526 |
| 50th percentile wage | $73,510 |
| 90th percentile wage | $103,367 |
 | | Top Employing Industries |
| Industry | Employment / Percent |
| Education and Health Services | 3,040 | 100% |
 |
| Top Paying Industries |
| Industry | Employment / Median Wage |
| Education and Health Services | 3,040 | $73,505 |
 | |
 |
| Elementary School Teachers, Ex. Special Education (25-2021) |
| Teach pupils in public or private schools at the elementary level basic academic, social, and other formative skills. Exclude "Special Education Teachers" (25-2041 through 25-2043). |
 |
| Mean Wage History |
| Year | This
Occupation | Compared to
Occupational Group | Difference |
| Current | $73510.14 | | $59104.35 |
| $14405.79 | | 2015 | $71643.22 | +2.6% | $57603.29 |
+2.6% | $14039.93 | | 2014 | $70301.36 | +1.9% | $56524.40 |
+1.9% | $13776.97 | | 2013 | $68959.51 | +1.9% | $55445.51 |
+1.9% | $13514.00 | | 2012 | $67617.66 | +2.0% | $54366.62 |
+2.0% | $13251.04 | | 2011 | $66567.52 | +1.6% | $53522.27 |
+1.6% | $13045.24 | | 2010 | $65400.69 | +1.8% | $52584.11 |
+1.8% | $12816.58 | | 2009 | $64700.59 | +1.1% | $52021.21 |
+1.1% | $12679.38 | | 2008 | $62775.33 | +3.1% | $50473.24 |
+3.1% | $12302.09 | | 2007 | $60675.04 | +3.5% | $48784.54 |
+3.5% | $11890.49 |
| Year | This
Occupation | Compared to
All Occupations | Difference |
| Current | $73510.14 | | $43637.40 |
| $29872.74 | | 2015 | $71643.22 | +2.6% | $42416.53 |
+2.9% | $29226.69 | | 2014 | $70301.36 | +1.9% | $41509.60 |
+2.2% | $28791.77 | | 2013 | $68959.51 | +1.9% | $40672.43 |
+2.1% | $28287.08 | | 2012 | $67617.66 | +2.0% | $39974.79 |
+1.7% | $27642.87 | | 2011 | $66567.52 | +1.6% | $39346.91 |
+1.6% | $27220.60 | | 2010 | $65400.69 | +1.8% | $38684.15 |
+1.7% | $26716.53 | | 2009 | $64700.59 | +1.1% | $38160.92 |
+1.4% | $26539.67 | | 2008 | $62775.33 | +3.1% | $37184.23 |
+2.6% | $25591.10 | | 2007 | $60675.04 | +3.5% | $35998.24 |
+3.3% | $24676.80 |
 |
|
| Reference Date: 1st Quarter 2016 |
| Top Areas For This Occupation |
|
| Highest Employment |
|
| Hartford |
$77,254 |
5,620 |
| Bridgeport |
$80,267 |
5,140 |
| New Haven |
$73,510 |
3,040 |
| Norwich-NL |
$70,051 |
1,150 |
| Waterbury |
$81,170 |
1,040 |
|
|

| |


