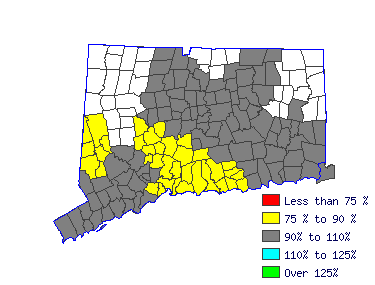
| Norwich-New London Labor Market Area (1Q 2015) |
| All Industry |
| Estimated employment | 380 |
| Mean wage | 23.62 |
| Entry wage | 15.73 |
| 10th percentile wage | 13.61 |
| 50th percentile wage | 22.68 |
| 90th percentile wage | 36.51 |
 |
| Top Employing Industries |
| Industry | Employment | % |
| Manufacturing | 230 | 59.2% |
| Trade, Transportation & Utilities | 50 | 12.5% |
| Professional & Business Services | 30 | 7.2% |
| Public Adminsitration | | |
 |
| Best Paying Industries |
| Industry | Employment | Median
Wage |
| Public Adminsitration |  | 25.84 |
| Manufacturing | 230 | 24.42 |
| Professional & Business Services | 30 | 21.89 |
| Trade, Transportation & Utilities | 50 | 21.39 |
 |


