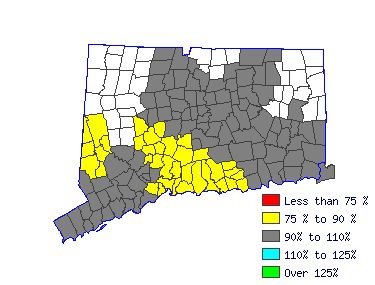
| Hartford Labor Market Area (1Q 2015) |
| All Industry |
| Estimated employment | 3,380 |
| Mean wage | 22.86 |
| Entry wage | 15.01 |
| 10th percentile wage | 13.62 |
| 50th percentile wage | 21.95 |
| 90th percentile wage | 34.47 |
 | | Top Employing Industries |
| Industry | Employment | % |
| Manufacturing | 2,530 | 74.9% |
| Trade, Transportation & Utilities | 330 | 9.8% |
| Professional & Business Services | 330 | 9.7% |
| Other Services | 80 | 2.5% |
| Public Adminsitration | 20 | 0.5% |
 |
| Best Paying Industries |
| Industry | Employment | Median
Wage |
| Public Adminsitration | 20 | 32.06 |
| Construction |  | 27.22 |
| Professional & Business Services | 330 | 23.84 |
| Manufacturing | 2,530 | 23.25 |
| Trade, Transportation & Utilities | 330 | 19.24 |
 | |
 |
| Inspectors, Testers, Sorters, Samplers, and Weighers (51-9061) |
| Inspect, test, sort, sample, or weigh nonagricultural raw materials or processed, machined, fabricated, or assembled parts or products for defects, wear, and deviations from specifications. May use precision measuring instruments and complex test equipment. |
| Mean Wage History |
| Year | This Occupation | Compared to
Occupational Group | Difference |
| Current | $22.86 | | $20.52 |
| $2.34 | | 2014 | $22.71 | +.7% | $20.38 |
+.7% | $2.32 | | 2013 | $22.19 | +2.3% | $19.92 |
+2.3% | $2.27 | | 2012 | $21.77 | +1.9% | $19.54 |
+1.9% | $2.23 | | 2011 | $21.41 | +1.7% | $19.22 |
+1.7% | $2.19 | | 2010 | $21.07 | +1.6% | $18.91 |
+1.6% | $2.16 | | 2009 | $20.84 | +1.1% | $18.71 |
+1.1% | $2.13 | | 2008 | $20.48 | +1.8% | $18.38 |
+1.8% | $2.10 | | 2007 | $19.94 | +2.7% | $17.90 |
+2.7% | $2.04 | | 2006 | $19.49 | +2.3% | $17.49 |
+2.3% | $1.99 |
| Year | This Occupation | Compared to
All Occupations | Difference |
| Current | $22.86 | | $27.23 |
| -$4.37 | | 2014 | $22.71 | +.7% | $27.01 |
+.8% | -$4.30 | | 2013 | $22.19 | +2.3% | $26.43 |
+2.2% | -$4.23 | | 2012 | $21.77 | +1.9% | $25.90 |
+2.1% | -$4.12 | | 2011 | $21.41 | +1.7% | $25.45 |
+1.7% | -$4.04 | | 2010 | $21.07 | +1.6% | $25.05 |
+1.6% | -$3.98 | | 2009 | $20.84 | +1.1% | $24.63 |
+1.7% | -$3.79 | | 2008 | $20.48 | +1.8% | $24.30 |
+1.4% | -$3.82 | | 2007 | $19.94 | +2.7% | $23.68 |
+2.6% | -$3.73 | | 2006 | $19.49 | +2.3% | $22.92 |
+3.3% | -$3.43 |
|
Reference Date: 1st Quarter 2015 |
State of Connecticut Department of Labor Office of Research
200 Folly Brook Boulevard Wethersfield, CT 06109
Phone: 860-263-6285 |

| | | | |
| Top Areas For This Occupation |
|
|
|
 |
|


