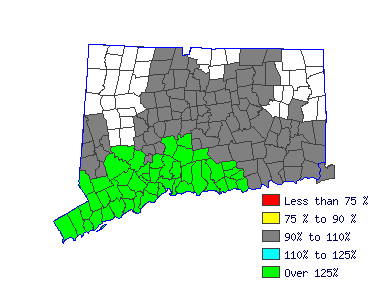
| Mean Wage History |
| Year | This Occupation | Compared to
Occupational Group | Difference |
| Current | $36725.95 | | $54085.09 |
| -$17359.14 |
| 2014 | $36547.38 | +.5% | $53822.12 |
+.5% | -$17274.73 |
| 2013 | $35862.86 | +1.9% | $52814.05 |
+1.9% | -$16951.18 |
| 2012 | $35178.34 | +1.9% | $51805.98 |
+1.9% | -$16627.63 |
| 2011 | $34493.82 | +2.0% | $50797.91 |
+2.0% | -$16304.08 |
| 2010 | $33958.11 | +1.6% | $50008.99 |
+1.6% | -$16050.87 |
| 2009 | $33362.88 | +1.8% | $49132.40 |
+1.8% | -$15769.52 |
| 2008 | $33005.74 | +1.1% | $48606.45 |
+1.1% | -$15600.71 |
| 2007 | $32023.60 | +3.1% | $47160.09 |
+3.1% | -$15136.49 |
| 2006 | $30952.18 | +3.5% | $45582.25 |
+3.5% | -$14630.06 |
| Year | This Occupation | Compared to
All Occupations | Difference |
| Current | $36725.95 | | $49386.50 |
| -$12660.55 |
| 2014 | $36547.38 | +.5% | $48983.67 |
+.8% | -$12436.29 |
| 2013 | $35862.86 | +1.9% | $47936.33 |
+2.2% | -$12073.46 |
| 2012 | $35178.34 | +1.9% | $46969.54 |
+2.1% | -$11791.20 |
| 2011 | $34493.82 | +2.0% | $46163.89 |
+1.7% | -$11670.06 |
| 2010 | $33958.11 | +1.6% | $45438.80 |
+1.6% | -$11480.69 |
| 2009 | $33362.88 | +1.8% | $44673.43 |
+1.7% | -$11310.55 |
| 2008 | $33005.74 | +1.1% | $44069.19 |
+1.4% | -$11063.45 |
| 2007 | $32023.60 | +3.1% | $42941.28 |
+2.6% | -$10917.67 |
| 2006 | $30952.18 | +3.5% | $41571.67 |
+3.3% | -$10619.49 |
|
Reference Date: 1st Quarter 2015 |
State of Connecticut Department of Labor Office of Research
200 Folly Brook Boulevard Wethersfield, CT 06109
Phone: 860-263-6285 |

| | | | |
| Top Areas For This Occupation |
|
|
|
 |


