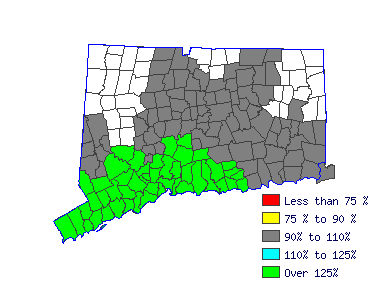
| Mean Wage History |
| Year | This Occupation | Compared to
Occupational Group | Difference |
| Current | $36878.04 | | $43955.55 |
| -$7077.51 |
| 2014 | $36698.73 | +.5% | $43741.83 |
+.5% | -$7043.09 |
| 2013 | $36011.38 | +1.9% | $42922.56 |
+1.9% | -$6911.18 |
| 2012 | $35324.02 | +1.9% | $42103.29 |
+1.9% | -$6779.26 |
| 2011 | $34636.67 | +2.0% | $41284.02 |
+2.0% | -$6647.35 |
| 2010 | $34098.74 | +1.6% | $40642.85 |
+1.6% | -$6544.11 |
| 2009 | $33501.04 | +1.8% | $39930.45 |
+1.8% | -$6429.40 |
| 2008 | $33142.42 | +1.1% | $39503.00 |
+1.1% | -$6360.58 |
| 2007 | $32156.22 | +3.1% | $38327.53 |
+3.1% | -$6171.31 |
| 2006 | $31080.36 | +3.5% | $37045.20 |
+3.5% | -$5964.83 |
| Year | This Occupation | Compared to
All Occupations | Difference |
| Current | $36878.04 | | $51791.62 |
| -$14913.58 |
| 2014 | $36698.73 | +.5% | $51369.18 |
+.8% | -$14670.44 |
| 2013 | $36011.38 | +1.9% | $50270.82 |
+2.2% | -$14259.44 |
| 2012 | $35324.02 | +1.9% | $49256.96 |
+2.1% | -$13932.93 |
| 2011 | $34636.67 | +2.0% | $48412.07 |
+1.7% | -$13775.40 |
| 2010 | $34098.74 | +1.6% | $47651.67 |
+1.6% | -$13552.93 |
| 2009 | $33501.04 | +1.8% | $46849.03 |
+1.7% | -$13347.98 |
| 2008 | $33142.42 | +1.1% | $46215.36 |
+1.4% | -$13072.94 |
| 2007 | $32156.22 | +3.1% | $45032.52 |
+2.6% | -$12876.30 |
| 2006 | $31080.36 | +3.5% | $43596.21 |
+3.3% | -$12515.85 |
|
Reference Date: 1st Quarter 2015 |
State of Connecticut Department of Labor Office of Research
200 Folly Brook Boulevard Wethersfield, CT 06109
Phone: 860-263-6285 |

| | | | |
| Top Areas For This Occupation |
|
|
|
 |


