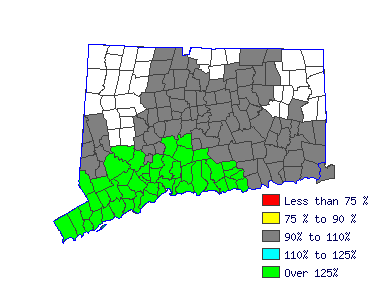
| Mean Wage History |
| Year | This Occupation | Compared to
Occupational Group | Difference |
| Current | $37385.03 | | $55200.46 |
| -$17815.43 |
| 2014 | $37203.26 | +.5% | $54932.06 |
+.5% | -$17728.80 |
| 2013 | $36506.45 | +1.9% | $53903.20 |
+1.9% | -$17396.75 |
| 2012 | $35809.65 | +1.9% | $52874.35 |
+1.9% | -$17064.69 |
| 2011 | $35112.84 | +2.0% | $51845.49 |
+2.0% | -$16732.64 |
| 2010 | $34567.52 | +1.6% | $51040.30 |
+1.6% | -$16472.77 |
| 2009 | $33961.60 | +1.8% | $50145.64 |
+1.8% | -$16184.03 |
| 2008 | $33598.05 | +1.1% | $49608.84 |
+1.1% | -$16010.78 |
| 2007 | $32598.29 | +3.1% | $48132.65 |
+3.1% | -$15534.36 |
| 2006 | $31507.64 | +3.5% | $46522.27 |
+3.5% | -$15014.62 |
| Year | This Occupation | Compared to
All Occupations | Difference |
| Current | $37385.03 | | $56642.63 |
| -$19257.60 |
| 2014 | $37203.26 | +.5% | $56180.62 |
+.8% | -$18977.36 |
| 2013 | $36506.45 | +1.9% | $54979.39 |
+2.2% | -$18472.93 |
| 2012 | $35809.65 | +1.9% | $53870.56 |
+2.1% | -$18060.91 |
| 2011 | $35112.84 | +2.0% | $52946.54 |
+1.7% | -$17833.69 |
| 2010 | $34567.52 | +1.6% | $52114.92 |
+1.6% | -$17547.39 |
| 2009 | $33961.60 | +1.8% | $51237.09 |
+1.7% | -$17275.49 |
| 2008 | $33598.05 | +1.1% | $50544.08 |
+1.4% | -$16946.02 |
| 2007 | $32598.29 | +3.1% | $49250.44 |
+2.6% | -$16652.15 |
| 2006 | $31507.64 | +3.5% | $47679.60 |
+3.3% | -$16171.96 |
|
Reference Date: 1st Quarter 2015 |
State of Connecticut Department of Labor Office of Research
200 Folly Brook Boulevard Wethersfield, CT 06109
Phone: 860-263-6285 |

| | | | |
| Top Areas For This Occupation |
|
|
|
 |


