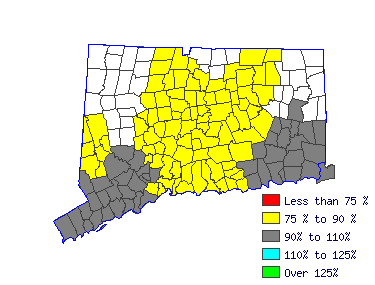
 |
| Mean Wage History |
| Year | This
Occupation | Compared to
Occupational Group | Difference |
| Current | $15.96 | | $22.20 |
| -$6.24 |
| 2015 | $15.45 | +3.3% | $21.50 |
+3.3% | -$6.04 |
| 2014 | $15.10 | +2.3% | $21.01 |
+2.3% | -$5.90 |
| 2013 | $14.82 | +1.9% | $20.61 |
+1.9% | -$5.79 |
| 2012 | $14.57 | +1.7% | $20.27 |
+1.7% | -$5.69 |
| 2011 | $14.34 | +1.6% | $19.94 |
+1.6% | -$5.60 |
| 2010 | $14.18 | +1.1% | $19.73 |
+1.1% | -$5.54 |
| 2009 | $13.94 | +1.8% | $19.38 |
+1.8% | -$5.44 |
| 2008 | $13.57 | +2.7% | $18.88 |
+2.7% | -$5.30 |
| 2007 | $13.26 | +2.3% | $18.45 |
+2.3% | -$5.18 |
| Year | This
Occupation | Compared to
All Occupations | Difference |
| Current | $15.96 | | $18.90 |
| -$2.94 |
| 2015 | $15.45 | +3.3% | $18.37 |
+2.9% | -$2.91 |
| 2014 | $15.10 | +2.3% | $17.98 |
+2.2% | -$2.87 |
| 2013 | $14.82 | +1.9% | $17.62 |
+2.1% | -$2.79 |
| 2012 | $14.57 | +1.7% | $17.31 |
+1.7% | -$2.74 |
| 2011 | $14.34 | +1.6% | $17.04 |
+1.6% | -$2.70 |
| 2010 | $14.18 | +1.1% | $16.75 |
+1.7% | -$2.57 |
| 2009 | $13.94 | +1.8% | $16.53 |
+1.4% | -$2.59 |
| 2008 | $13.57 | +2.7% | $16.11 |
+2.6% | -$2.53 |
| 2007 | $13.26 | +2.3% | $15.59 |
+3.3% | -$2.33 |
 |
|
| Reference Date: 1st Quarter 2016 |


