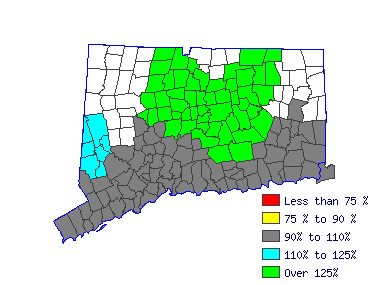
| Apply engineering theory and principles to problems of industrial layout or manufacturing production, usually under the direction of engineering staff. May study and record time, motion, method, and speed involved in performance of production, maintenance, clerical, and other worker operations for such purposes as establishing standard production rates or improving efficiency. |
 |
| Mean Wage History |
| Year | This
Occupation | Compared to
Occupational Group | Difference |
| Current | $26.89 | | $37.84 |
| -$10.95 |
| 2015 | $26.21 | +2.6% | $36.88 |
+2.6% | -$10.67 |
| 2014 | $25.72 | +1.9% | $36.19 |
+1.9% | -$10.47 |
| 2013 | $25.23 | +1.9% | $35.50 |
+1.9% | -$10.27 |
| 2012 | $24.73 | +2.0% | $34.81 |
+2.0% | -$10.07 |
| 2011 | $24.35 | +1.6% | $34.27 |
+1.6% | -$9.91 |
| 2010 | $23.92 | +1.8% | $33.67 |
+1.8% | -$9.74 |
| 2009 | $23.67 | +1.1% | $33.31 |
+1.1% | -$9.63 |
| 2008 | $22.96 | +3.1% | $32.31 |
+3.1% | -$9.35 |
| 2007 | $22.19 | +3.5% | $31.23 |
+3.5% | -$9.03 |
| Year | This
Occupation | Compared to
All Occupations | Difference |
| Current | $26.89 | | $18.90 |
| $7.99 |
| 2015 | $26.21 | +2.6% | $18.37 |
+2.9% | $7.84 |
| 2014 | $25.72 | +1.9% | $17.98 |
+2.2% | $7.74 |
| 2013 | $25.23 | +1.9% | $17.62 |
+2.1% | $7.61 |
| 2012 | $24.73 | +2.0% | $17.31 |
+1.7% | $7.42 |
| 2011 | $24.35 | +1.6% | $17.04 |
+1.6% | $7.31 |
| 2010 | $23.92 | +1.8% | $16.75 |
+1.7% | $7.17 |
| 2009 | $23.67 | +1.1% | $16.53 |
+1.4% | $7.14 |
| 2008 | $22.96 | +3.1% | $16.11 |
+2.6% | $6.86 |
| 2007 | $22.19 | +3.5% | $15.59 |
+3.3% | $6.60 |
 |
|
| Reference Date: 1st Quarter 2016 |


