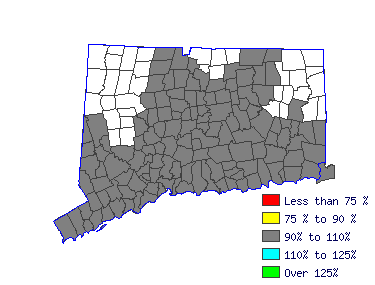
| Norwich-New London Labor Market Area (1Q 2015) |
| All Industry |
| Estimated employment | 2,390 |
| Mean wage | 11.00 |
| Entry wage | 9.09 |
| 10th percentile wage | 8.98 |
| 50th percentile wage | 9.95 |
| 90th percentile wage | 14.48 |
 |
| Top Employing Industries |
| Industry | Employment | % |
| Leisure and Hospitality | 1,700 | 71.1% |
| Education & Health Services | 140 | 5.9% |
| Public Adminsitration | 110 | 4.5% |
| Trade, Transportation & Utilities | | |
 |
| Best Paying Industries |
| Industry | Employment | Median
Wage |
| Education & Health Services | 140 | 12.65 |
| Public Adminsitration | 110 | 12.46 |
| Trade, Transportation & Utilities |  | 11.81 |
| Leisure and Hospitality | 1,700 | 10.86 |
 |


