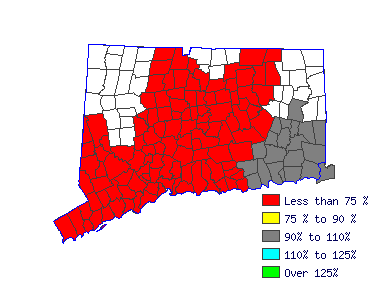
| Mean Wage History |
| Year | This Occupation | Compared to
Occupational Group | Difference |
| Current | $99064.75 | | $57137.14 |
| $41927.61 |
| 2014 | $98583.07 | +.5% | $56859.33 |
+.5% | $41723.75 |
| 2013 | $96736.65 | +1.9% | $55794.37 |
+1.9% | $40942.28 |
| 2012 | $94890.22 | +1.9% | $54729.42 |
+1.9% | $40160.81 |
| 2011 | $93043.80 | +2.0% | $53664.46 |
+2.0% | $39379.34 |
| 2010 | $91598.77 | +1.6% | $52831.02 |
+1.6% | $38767.75 |
| 2009 | $89993.18 | +1.8% | $51904.97 |
+1.8% | $38088.21 |
| 2008 | $89029.83 | +1.1% | $51349.34 |
+1.1% | $37680.49 |
| 2007 | $86380.61 | +3.1% | $49821.36 |
+3.1% | $36559.25 |
| 2006 | $83490.55 | +3.5% | $48154.48 |
+3.5% | $35336.07 |
| Year | This Occupation | Compared to
All Occupations | Difference |
| Current | $99064.75 | | $49386.50 |
| $49678.25 |
| 2014 | $98583.07 | +.5% | $48983.67 |
+.8% | $49599.40 |
| 2013 | $96736.65 | +1.9% | $47936.33 |
+2.2% | $48800.32 |
| 2012 | $94890.22 | +1.9% | $46969.54 |
+2.1% | $47920.68 |
| 2011 | $93043.80 | +2.0% | $46163.89 |
+1.7% | $46879.91 |
| 2010 | $91598.77 | +1.6% | $45438.80 |
+1.6% | $46159.97 |
| 2009 | $89993.18 | +1.8% | $44673.43 |
+1.7% | $45319.75 |
| 2008 | $89029.83 | +1.1% | $44069.19 |
+1.4% | $44960.63 |
| 2007 | $86380.61 | +3.1% | $42941.28 |
+2.6% | $43439.33 |
| 2006 | $83490.55 | +3.5% | $41571.67 |
+3.3% | $41918.88 |
|
Reference Date: 1st Quarter 2015 |
State of Connecticut Department of Labor Office of Research
200 Folly Brook Boulevard Wethersfield, CT 06109
Phone: 860-263-6285 |

| | | | |
| Top Areas For This Occupation |
|
|
|
 |


