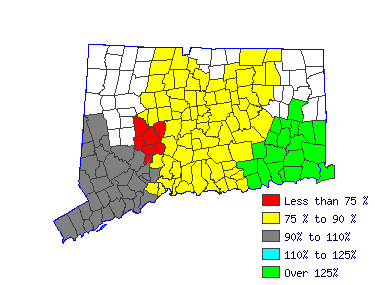
| Mean Wage History |
| Year | This Occupation | Compared to
Occupational Group | Difference |
| Current | $70146.36 | | $53517.27 |
| $16629.09 |
| 2014 | $69805.29 | +.5% | $53257.06 |
+.5% | $16548.24 |
| 2013 | $68497.86 | +1.9% | $52259.57 |
+1.9% | $16238.29 |
| 2012 | $67190.44 | +1.9% | $51262.09 |
+1.9% | $15928.35 |
| 2011 | $65883.01 | +2.0% | $50264.60 |
+2.0% | $15618.41 |
| 2010 | $64859.80 | +1.6% | $49483.96 |
+1.6% | $15375.84 |
| 2009 | $63722.91 | +1.8% | $48616.58 |
+1.8% | $15106.33 |
| 2008 | $63040.77 | +1.1% | $48096.15 |
+1.1% | $14944.62 |
| 2007 | $61164.90 | +3.1% | $46664.98 |
+3.1% | $14499.92 |
| 2006 | $59118.49 | +3.5% | $45103.70 |
+3.5% | $14014.79 |
| Year | This Occupation | Compared to
All Occupations | Difference |
| Current | $70146.36 | | $51791.62 |
| $18354.74 |
| 2014 | $69805.29 | +.5% | $51369.18 |
+.8% | $18436.12 |
| 2013 | $68497.86 | +1.9% | $50270.82 |
+2.2% | $18227.04 |
| 2012 | $67190.44 | +1.9% | $49256.96 |
+2.1% | $17933.48 |
| 2011 | $65883.01 | +2.0% | $48412.07 |
+1.7% | $17470.94 |
| 2010 | $64859.80 | +1.6% | $47651.67 |
+1.6% | $17208.13 |
| 2009 | $63722.91 | +1.8% | $46849.03 |
+1.7% | $16873.88 |
| 2008 | $63040.77 | +1.1% | $46215.36 |
+1.4% | $16825.41 |
| 2007 | $61164.90 | +3.1% | $45032.52 |
+2.6% | $16132.38 |
| 2006 | $59118.49 | +3.5% | $43596.21 |
+3.3% | $15522.28 |
|
Reference Date: 1st Quarter 2015 |
State of Connecticut Department of Labor Office of Research
200 Folly Brook Boulevard Wethersfield, CT 06109
Phone: 860-263-6285 |

| | | | |
| Top Areas For This Occupation |
|
|
|
 |


