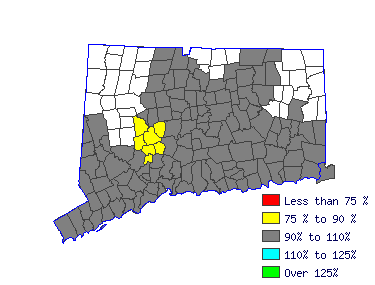
| Norwich-New London Labor Market Area (1Q 2015) |
| All Industry |
| Estimated employment | 2,160 |
| Mean wage | 41.15 |
| Entry wage | 24.94 |
| 10th percentile wage | 21.78 |
| 50th percentile wage | 39.27 |
| 90th percentile wage | 62.64 |
 |
| Top Employing Industries |
| Industry | Employment | % |
| Professional & Business Services | 1,030 | 47.5% |
| Education & Health Services | 190 | 8.7% |
| Public Adminsitration | 130 | 5.8% |
| Trade, Transportation & Utilities | 80 | 3.9% |
| Financial Activities | 70 | 3.3% |
 |
| Best Paying Industries |
| Industry | Employment | Median
Wage |
| Professional & Business Services | 1,030 | 46.13 |
| Public Adminsitration | 130 | 40.09 |
| Financial Activities | 70 | 39.30 |
| Manufacturing |  | 38.99 |
| Information |  | 38.77 |
 |


