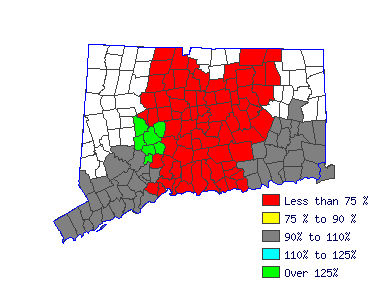
| Mean Wage History |
| Year | This Occupation | Compared to
Occupational Group | Difference |
| Current | $49501.96 | | $115582.30 |
| -$66080.34 |
| 2014 | $49221.15 | +.6% | $114926.65 |
+.6% | -$65705.49 |
| 2013 | $48057.82 | +2.4% | $112210.37 |
+2.4% | -$64152.55 |
| 2012 | $46894.48 | +2.5% | $109494.09 |
+2.5% | -$62599.60 |
| 2011 | $46132.30 | +1.7% | $107714.46 |
+1.7% | -$61582.16 |
| 2010 | $45410.23 | +1.6% | $106028.50 |
+1.6% | -$60618.26 |
| 2009 | $44447.46 | +2.2% | $103780.54 |
+2.2% | -$59333.07 |
| 2008 | $44126.54 | +.7% | $103031.22 |
+.7% | -$58904.67 |
| 2007 | $42762.63 | +3.2% | $99846.62 |
+3.2% | -$57083.98 |
| 2006 | $41358.61 | +3.4% | $96568.36 |
+3.4% | -$55209.74 |
| Year | This Occupation | Compared to
All Occupations | Difference |
| Current | $49501.96 | | $49386.50 |
| $115.46 |
| 2014 | $49221.15 | +.6% | $48983.67 |
+.8% | $237.48 |
| 2013 | $48057.82 | +2.4% | $47936.33 |
+2.2% | $121.49 |
| 2012 | $46894.48 | +2.5% | $46969.54 |
+2.1% | -$75.06 |
| 2011 | $46132.30 | +1.7% | $46163.89 |
+1.7% | -$31.59 |
| 2010 | $45410.23 | +1.6% | $45438.80 |
+1.6% | -$28.57 |
| 2009 | $44447.46 | +2.2% | $44673.43 |
+1.7% | -$225.96 |
| 2008 | $44126.54 | +.7% | $44069.19 |
+1.4% | $57.35 |
| 2007 | $42762.63 | +3.2% | $42941.28 |
+2.6% | -$178.64 |
| 2006 | $41358.61 | +3.4% | $41571.67 |
+3.3% | -$213.06 |
|
Reference Date: 1st Quarter 2015 |
State of Connecticut Department of Labor Office of Research
200 Folly Brook Boulevard Wethersfield, CT 06109
Phone: 860-263-6285 |

| | | | |
| Top Areas For This Occupation |
|
|
|
 |


