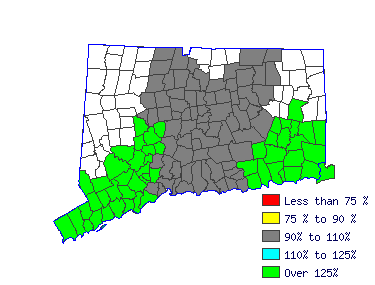
| Mean Wage History |
| Year | This Occupation | Compared to
Occupational Group | Difference |
| Current | $34363.40 | | $121483.60 |
| -$87120.20 |
| 2014 | $34168.47 | +.6% | $120794.47 |
+.6% | -$86626.00 |
| 2013 | $33360.90 | +2.4% | $117939.51 |
+2.4% | -$84578.60 |
| 2012 | $32553.33 | +2.5% | $115084.54 |
+2.5% | -$82531.21 |
| 2011 | $32024.24 | +1.7% | $113214.05 |
+1.7% | -$81189.81 |
| 2010 | $31522.99 | +1.6% | $111442.01 |
+1.6% | -$79919.01 |
| 2009 | $30854.66 | +2.2% | $109079.28 |
+2.2% | -$78224.62 |
| 2008 | $30631.88 | +.7% | $108291.70 |
+.7% | -$77659.82 |
| 2007 | $29685.08 | +3.2% | $104944.50 |
+3.2% | -$75259.42 |
| 2006 | $28710.43 | +3.4% | $101498.86 |
+3.4% | -$72788.43 |
| Year | This Occupation | Compared to
All Occupations | Difference |
| Current | $34363.40 | | $54369.99 |
| -$20006.59 |
| 2014 | $34168.47 | +.6% | $53926.52 |
+.8% | -$19758.04 |
| 2013 | $33360.90 | +2.4% | $52773.48 |
+2.2% | -$19412.57 |
| 2012 | $32553.33 | +2.5% | $51709.14 |
+2.1% | -$19155.80 |
| 2011 | $32024.24 | +1.7% | $50822.19 |
+1.7% | -$18797.95 |
| 2010 | $31522.99 | +1.6% | $50023.94 |
+1.6% | -$18500.94 |
| 2009 | $30854.66 | +2.2% | $49181.34 |
+1.7% | -$18326.67 |
| 2008 | $30631.88 | +.7% | $48516.12 |
+1.4% | -$17884.24 |
| 2007 | $29685.08 | +3.2% | $47274.40 |
+2.6% | -$17589.31 |
| 2006 | $28710.43 | +3.4% | $45766.58 |
+3.3% | -$17056.15 |
|
Reference Date: 1st Quarter 2015 |
State of Connecticut Department of Labor Office of Research
200 Folly Brook Boulevard Wethersfield, CT 06109
Phone: 860-263-6285 |

| | | | |
| Top Areas For This Occupation |
|
|
|
 |


