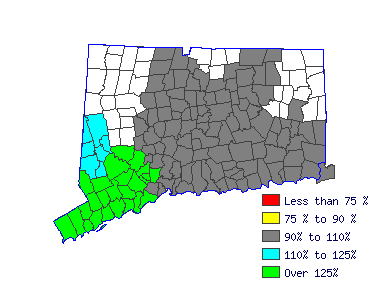
| Norwich-New London Labor Market Area (1Q 2015) |
| All Industry |
| Estimated employment | 6,150 |
| Mean wage | 55.57 |
| Entry wage | 28.76 |
| 10th percentile wage | 24.64 |
| 50th percentile wage | 48.66 |
| 90th percentile wage | N/A |
 |
| Top Employing Industries |
| Industry | Employment | % |
| Manufacturing | 1,340 | 21.8% |
| Education & Health Services | 1,190 | 19.4% |
| Leisure and Hospitality | 860 | 13.9% |
| Professional & Business Services | 760 | 12.4% |
| Trade, Transportation & Utilities | 690 | 11.2% |
 |
| Best Paying Industries |
| Industry | Employment | Median
Wage |
| Manufacturing | 1,340 | 68.56 |
| Professional & Business Services | 760 | 59.70 |
| Construction | 210 | 56.73 |
| Other Services | 90 | 56.06 |
| Trade, Transportation & Utilities | 690 | 55.91 |
 |


