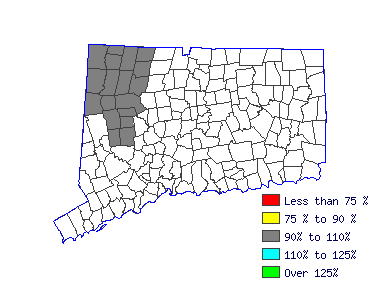
Torrington LMA (1Q 2016) |
All Industry |
Estimated employment | 230 |
Mean wage | $19.64 |
Entry wage | $12.68 |
10th percentile wage | $10.53 |
50th percentile wage | $19.63 |
90th percentile wage | $30.02 |
| Top Employing Industries |
Industry | Employment / Percent |
Education and Health Services | 120 | 51.5% |
Financial Activities | 30 | 11.4% |
Manufacturing | 20 | 10.7% |
Other Services | 20 | 8.4% |
Professional and Business Services | 10 | 4.9% |
|
Top Paying Industries |
Industry | Employment / Median Wage |
Public Administration | 10 | $27.90 |
Financial Activities | 30 | $21.50 |
Professional and Business Services | 10 | $20.93 |
Manufacturing | 20 | $19.55 |
Education and Health Services | 120 | $19.21 |
| |
|
Maintenance and Repair Workers, General (49-9071) |
Perform work involving the skills of two or more maintenance or craft occupations to keep machines, mechanical equipment, or the structure of an establishment in repair. Duties may involve pipe fitting; boiler making; insulating; welding; machining; carpentry; repairing electrical or mechanical equipment; installing, aligning, and balancing new equipment; and repairing buildings, floors, or stairs. Exclude "Maintenance Workers, Machinery" (49-9043). |
|
Mean Wage History |
Year | This Occupation | Compared to Occupational Group | Difference |
Current | $19.63 | | $21.70 |
| -$2.07 | 2015 | $19.14 | +2.5% | $21.16 |
+2.5% | -$2.01 | 2014 | $18.75 | +2.1% | $20.73 |
+2.1% | -$1.97 | 2013 | $18.36 | +2.1% | $20.29 |
+2.1% | -$1.93 | 2012 | $18.09 | +1.5% | $20.00 |
+1.5% | -$1.90 | 2011 | $17.70 | +2.2% | $19.56 |
+2.2% | -$1.86 | 2010 | $17.49 | +1.2% | $19.34 |
+1.2% | -$1.84 | 2009 | $17.19 | +1.7% | $19.00 |
+1.7% | -$1.81 | 2008 | $16.69 | +3.0% | $18.45 |
+3.0% | -$1.75 | 2007 | $16.20 | +3.0% | $17.91 |
+3.0% | -$1.70 |
Year | This Occupation | Compared to All Occupations | Difference |
Current | $19.63 | | $18.42 |
| $1.21 | 2015 | $19.14 | +2.5% | $17.90 |
+2.9% | $1.24 | 2014 | $18.75 | +2.1% | $17.52 |
+2.2% | $1.23 | 2013 | $18.36 | +2.1% | $17.17 |
+2.1% | $1.19 | 2012 | $18.09 | +1.5% | $16.87 |
+1.7% | $1.21 | 2011 | $17.70 | +2.2% | $16.61 |
+1.6% | $1.09 | 2010 | $17.49 | +1.2% | $16.33 |
+1.7% | $1.16 | 2009 | $17.19 | +1.7% | $16.11 |
+1.4% | $1.08 | 2008 | $16.69 | +3.0% | $15.70 |
+2.6% | $0.99 | 2007 | $16.20 | +3.0% | $15.20 |
+3.3% | $1.01 |
|
Reference Date: 1st Quarter 2016 |
|