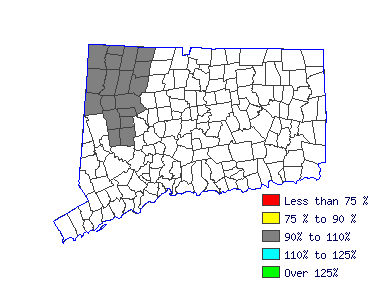
| Torrington LMA (1Q 2016) |
| All Industry |
| Estimated employment | 910 |
| Mean wage | $30.66 |
| Entry wage | $16.11 |
| 10th percentile wage | $13.99 |
| 50th percentile wage | $27.05 |
| 90th percentile wage | $50.08 |
 |
| Top Employing Industries |
| Industry | Employment / Percent |
| Professional and Business Services | 260 | 28.5% |
| Education and Health Services | 180 | 19.2% |
| Financial Activities | 90 | 10.3% |
| Construction | 90 | 10.1% |
| Manufacturing | 80 | 9.1% |
 |
| Top Paying Industries |
| Industry | Employment / Median Wage |
| Financial Activities | 90 | $36.09 |
| Construction | 90 | $34.46 |
| Public Administration | 70 | $28.26 |
| Manufacturing | 80 | $27.23 |
| Professional and Business Services | 260 | $25.77 |
 |


