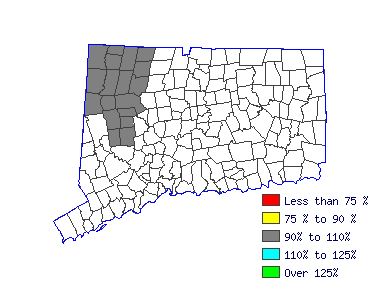
| Plan, direct, or coordinate selling, buying, leasing, or governance activities of commercial, industrial, or residential real estate properties. Include managers of homeowner and condominium associations, rented or leased housing units, buildings, or land (including rights-of-way). |
 |
| Mean Wage History |
| Year | This
Occupation | Compared to
Occupational Group | Difference |
| Current | $24.71 | | $42.49 |
| -$17.78 |
| 2015 | $23.85 | +3.6% | $41.02 |
+3.6% | -$17.16 |
| 2014 | $23.29 | +2.4% | $40.05 |
+2.4% | -$16.75 |
| 2013 | $22.73 | +2.5% | $39.08 |
+2.5% | -$16.35 |
| 2012 | $22.36 | +1.7% | $38.44 |
+1.7% | -$16.08 |
| 2011 | $22.01 | +1.6% | $37.84 |
+1.6% | -$15.83 |
| 2010 | $21.54 | +2.2% | $37.04 |
+2.2% | -$15.49 |
| 2009 | $21.39 | +.7% | $36.77 |
+.7% | -$15.38 |
| 2008 | $20.72 | +3.2% | $35.64 |
+3.2% | -$14.91 |
| 2007 | $20.04 | +3.4% | $34.47 |
+3.4% | -$14.42 |
| Year | This
Occupation | Compared to
All Occupations | Difference |
| Current | $24.71 | | $18.42 |
| $6.29 |
| 2015 | $23.85 | +3.6% | $17.90 |
+2.9% | $5.95 |
| 2014 | $23.29 | +2.4% | $17.52 |
+2.2% | $5.77 |
| 2013 | $22.73 | +2.5% | $17.17 |
+2.1% | $5.56 |
| 2012 | $22.36 | +1.7% | $16.87 |
+1.7% | $5.48 |
| 2011 | $22.01 | +1.6% | $16.61 |
+1.6% | $5.40 |
| 2010 | $21.54 | +2.2% | $16.33 |
+1.7% | $5.21 |
| 2009 | $21.39 | +.7% | $16.11 |
+1.4% | $5.28 |
| 2008 | $20.72 | +3.2% | $15.70 |
+2.6% | $5.03 |
| 2007 | $20.04 | +3.4% | $15.20 |
+3.3% | $4.85 |
 |
|
| Reference Date: 1st Quarter 2016 |


