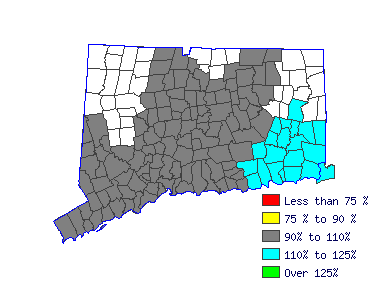
 |
| Mean Wage History |
| Year | This
Occupation | Compared to
Occupational Group | Difference |
| Current | $30.10 | | $19.16 |
| $10.94 |
| 2015 | $29.15 | +3.3% | $18.55 |
+3.3% | $10.59 |
| 2014 | $28.48 | +2.3% | $18.13 |
+2.3% | $10.35 |
| 2013 | $27.95 | +1.9% | $17.79 |
+1.9% | $10.16 |
| 2012 | $27.48 | +1.7% | $17.49 |
+1.7% | $9.99 |
| 2011 | $27.04 | +1.6% | $17.21 |
+1.6% | $9.83 |
| 2010 | $26.75 | +1.1% | $17.03 |
+1.1% | $9.72 |
| 2009 | $26.28 | +1.8% | $16.73 |
+1.8% | $9.55 |
| 2008 | $25.60 | +2.7% | $16.29 |
+2.7% | $9.30 |
| 2007 | $25.01 | +2.3% | $15.92 |
+2.3% | $9.09 |
| Year | This
Occupation | Compared to
All Occupations | Difference |
| Current | $30.10 | | $22.30 |
| $7.80 |
| 2015 | $29.15 | +3.3% | $21.68 |
+2.9% | $7.47 |
| 2014 | $28.48 | +2.3% | $21.21 |
+2.2% | $7.27 |
| 2013 | $27.95 | +1.9% | $20.78 |
+2.1% | $7.16 |
| 2012 | $27.48 | +1.7% | $20.43 |
+1.7% | $7.05 |
| 2011 | $27.04 | +1.6% | $20.11 |
+1.6% | $6.93 |
| 2010 | $26.75 | +1.1% | $19.77 |
+1.7% | $6.98 |
| 2009 | $26.28 | +1.8% | $19.50 |
+1.4% | $6.78 |
| 2008 | $25.60 | +2.7% | $19.00 |
+2.6% | $6.59 |
| 2007 | $25.01 | +2.3% | $18.40 |
+3.3% | $6.61 |
 |
|
| Reference Date: 1st Quarter 2016 |


