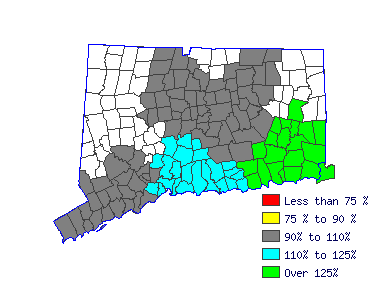
CT.Gov Home Connecticut LMI 1Q 2016 Connecticut Occupational Employment & Wages Home
Select Occupation
Hartford LMA (1Q 2016)
All Industry
Estimated employment560
Mean wage$46.51
Entry wage$31.63
10th percentile wage$30.79
50th percentile wage$43.20
90th percentile wage$65.53
Top Employing Industries
 IndustryEmployment / Percent
Financial Activities41073.2%
Professional and Business Services10017.2%
Trade, Transportation and Utilities203.7%
Top Paying Industries
 IndustryEmployment / Median Wage
Trade, Transportation and Utilities20$44.28
Financial Activities410$43.42
Professional and Business Services100$43.12
Operations Research Analysts (15-2031)
Formulate and apply mathematical modeling and other optimizing methods using a computer to develop and interpret information that assists management with decision making, policy formulation, or other managerial functions. May develop related software, service, or products. Frequently concentrates on collecting and analyzing data and developing decision support software. May develop and supply optimal time, cost, or logistics networks for program evaluation, review, or implementation.
Mean Wage History
YearThis
Occupation
Compared to
Occupational Group
Difference
Current$43.20 $42.19  $1.01
2015$42.10+2.6%$41.12 +2.6%$0.98
2014$41.31+1.9%$40.35 +1.9%$0.97
2013$40.53+1.9%$39.58 +1.9%$0.95
2012$39.74+2.0%$38.81 +2.0%$0.93
2011$39.12+1.6%$38.21 +1.6%$0.91
2010$38.43+1.8%$37.54 +1.8%$0.90
2009$38.02+1.1%$37.13 +1.1%$0.89
2008$36.89+3.1%$36.03 +3.1%$0.86
2007$35.66+3.5%$34.82 +3.5%$0.83
YearThis
Occupation
Compared to
All Occupations
Difference
Current$43.20 $22.30  $20.90
2015$42.10+2.6%$21.68 +2.9%$20.43
2014$41.31+1.9%$21.21 +2.2%$20.10
2013$40.53+1.9%$20.78 +2.1%$19.74
2012$39.74+2.0%$20.43 +1.7%$19.31
2011$39.12+1.6%$20.11 +1.6%$19.01
2010$38.43+1.8%$19.77 +1.7%$18.67
2009$38.02+1.1%$19.50 +1.4%$18.52
2008$36.89+3.1%$19.00 +2.6%$17.89
2007$35.66+3.5%$18.40 +3.3%$17.26
Note: The mid-wage is the median wage. The average wage is the mean wage. The entry-level wage is equal to the average of the lower third of reported wages for the occupation. The wage range consists of the 10th and 90th percentiles; 80% of workers earn between this wage range, 10% earn less while 10% earn more.
Reference Date: 1st Quarter 2016
Top Areas For This Occupation
Best Pay
Median Wage / Employment
Norwich-NL $55.24 70
New Haven $53.08 40
Bridgeport $43.82 400
Hartford $43.20 560
Highest Employment
Median Wage / Employment
Hartford $43.20 560
Bridgeport $43.82 400
Norwich-NL $55.24 70
New Haven $53.08 40
Wages in other areas
Go Connecticut LMI Home State of Connecticut Department of Labor - Office of Research
200 Folly Brook Boulevard, Wethersfield, CT 06109 / Phone: 860-263-6285
LMI Home | CTDOL Home | CT.gov | Feedback | Disclaimer | Privacy Policy | Accessibility Policy
Go to the State of Connecticut website