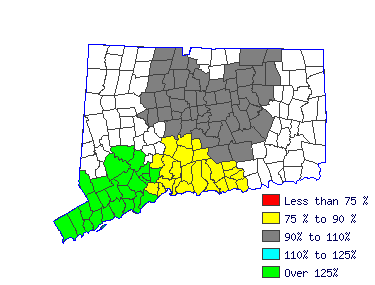
| Coordinate disaster response or crisis management activities, provide disaster preparedness training, and prepare emergency plans and procedures for natural (e.g., hurricanes, floods, earthquakes), wartime, or technological (e.g., nuclear power plant emergencies, hazardous materials spills) disasters or hostage situations. |
 |
| Mean Wage History |
| Year | This
Occupation | Compared to
Occupational Group | Difference |
| Current | $37.38 | | $54.90 |
| -$17.52 |
| 2015 | $36.09 | +3.6% | $53.00 |
+3.6% | -$16.91 |
| 2014 | $35.23 | +2.4% | $51.75 |
+2.4% | -$16.51 |
| 2013 | $34.38 | +2.5% | $50.49 |
+2.5% | -$16.11 |
| 2012 | $33.82 | +1.7% | $49.67 |
+1.7% | -$15.85 |
| 2011 | $33.29 | +1.6% | $48.90 |
+1.6% | -$15.60 |
| 2010 | $32.59 | +2.2% | $47.86 |
+2.2% | -$15.27 |
| 2009 | $32.35 | +.7% | $47.51 |
+.7% | -$15.16 |
| 2008 | $31.35 | +3.2% | $46.05 |
+3.2% | -$14.69 |
| 2007 | $30.32 | +3.4% | $44.53 |
+3.4% | -$14.21 |
| Year | This
Occupation | Compared to
All Occupations | Difference |
| Current | $37.38 | | $22.30 |
| $15.08 |
| 2015 | $36.09 | +3.6% | $21.68 |
+2.9% | $14.41 |
| 2014 | $35.23 | +2.4% | $21.21 |
+2.2% | $14.02 |
| 2013 | $34.38 | +2.5% | $20.78 |
+2.1% | $13.60 |
| 2012 | $33.82 | +1.7% | $20.43 |
+1.7% | $13.39 |
| 2011 | $33.29 | +1.6% | $20.11 |
+1.6% | $13.18 |
| 2010 | $32.59 | +2.2% | $19.77 |
+1.7% | $12.82 |
| 2009 | $32.35 | +.7% | $19.50 |
+1.4% | $12.85 |
| 2008 | $31.35 | +3.2% | $19.00 |
+2.6% | $12.35 |
| 2007 | $30.32 | +3.4% | $18.40 |
+3.3% | $11.93 |
 |
|
| Reference Date: 1st Quarter 2016 |


