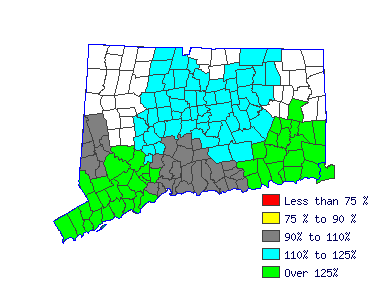
| Set up and operate a variety of machine tools to produce precision parts and instruments. Include precision instrument makers who fabricate, modify, or repair mechanical instruments. May also fabricate and modify parts to make or repair machine tools or maintain industrial machines, applying knowledge of mechanics, shop mathematics, metal properties, layout, and machining procedures. |
 |
| Mean Wage History |
| Year | This
Occupation | Compared to
Occupational Group | Difference |
| Current | $19.34 | | $18.47 |
| $0.87 |
| 2015 | $18.73 | +3.3% | $17.88 |
+3.3% | $0.84 |
| 2014 | $18.30 | +2.3% | $17.48 |
+2.3% | $0.82 |
| 2013 | $17.96 | +1.9% | $17.15 |
+1.9% | $0.81 |
| 2012 | $17.66 | +1.7% | $16.86 |
+1.7% | $0.79 |
| 2011 | $17.37 | +1.6% | $16.59 |
+1.6% | $0.78 |
| 2010 | $17.19 | +1.1% | $16.41 |
+1.1% | $0.77 |
| 2009 | $16.89 | +1.8% | $16.13 |
+1.8% | $0.76 |
| 2008 | $16.45 | +2.7% | $15.71 |
+2.7% | $0.74 |
| 2007 | $16.07 | +2.3% | $15.35 |
+2.3% | $0.72 |
| Year | This
Occupation | Compared to
All Occupations | Difference |
| Current | $19.34 | | $19.47 |
| -$0.13 |
| 2015 | $18.73 | +3.3% | $18.93 |
+2.9% | -$0.19 |
| 2014 | $18.30 | +2.3% | $18.52 |
+2.2% | -$0.21 |
| 2013 | $17.96 | +1.9% | $18.15 |
+2.1% | -$0.19 |
| 2012 | $17.66 | +1.7% | $17.84 |
+1.7% | -$0.17 |
| 2011 | $17.37 | +1.6% | $17.56 |
+1.6% | -$0.18 |
| 2010 | $17.19 | +1.1% | $17.26 |
+1.7% | -$0.07 |
| 2009 | $16.89 | +1.8% | $17.03 |
+1.4% | -$0.13 |
| 2008 | $16.45 | +2.7% | $16.59 |
+2.6% | -$0.14 |
| 2007 | $16.07 | +2.3% | $16.06 |
+3.3% | $0.01 |
 |
|
| Reference Date: 1st Quarter 2016 |


