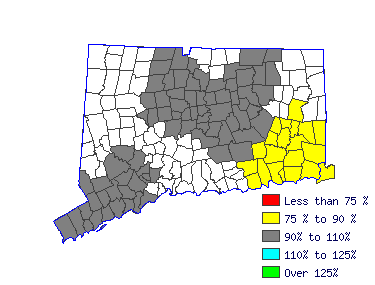
| Grind, sand, or polish, using hand tools or hand-held power tools, a variety of metal, wood, stone, clay, plastic, or glass objects. Include chippers, buffers, and finishers. |
 |
| Mean Wage History |
| Year | This
Occupation | Compared to
Occupational Group | Difference |
| Current | $18.92 | | $19.27 |
| -$0.34 |
| 2015 | $18.32 | +3.3% | $18.66 |
+3.3% | -$0.33 |
| 2014 | $17.90 | +2.3% | $18.24 |
+2.3% | -$0.33 |
| 2013 | $17.57 | +1.9% | $17.89 |
+1.9% | -$0.32 |
| 2012 | $17.27 | +1.7% | $17.59 |
+1.7% | -$0.31 |
| 2011 | $17.00 | +1.6% | $17.31 |
+1.6% | -$0.31 |
| 2010 | $16.81 | +1.1% | $17.12 |
+1.1% | -$0.31 |
| 2009 | $16.52 | +1.8% | $16.83 |
+1.8% | -$0.30 |
| 2008 | $16.09 | +2.7% | $16.39 |
+2.7% | -$0.29 |
| 2007 | $15.72 | +2.3% | $16.01 |
+2.3% | -$0.29 |
| Year | This
Occupation | Compared to
All Occupations | Difference |
| Current | $18.92 | | $22.98 |
| -$4.06 |
| 2015 | $18.32 | +3.3% | $22.34 |
+2.9% | -$4.01 |
| 2014 | $17.90 | +2.3% | $21.86 |
+2.2% | -$3.95 |
| 2013 | $17.57 | +1.9% | $21.42 |
+2.1% | -$3.85 |
| 2012 | $17.27 | +1.7% | $21.05 |
+1.7% | -$3.77 |
| 2011 | $17.00 | +1.6% | $20.72 |
+1.6% | -$3.72 |
| 2010 | $16.81 | +1.1% | $20.37 |
+1.7% | -$3.55 |
| 2009 | $16.52 | +1.8% | $20.10 |
+1.4% | -$3.57 |
| 2008 | $16.09 | +2.7% | $19.58 |
+2.6% | -$3.49 |
| 2007 | $15.72 | +2.3% | $18.96 |
+3.3% | -$3.23 |
 |
|
| Reference Date: 1st Quarter 2016 |


