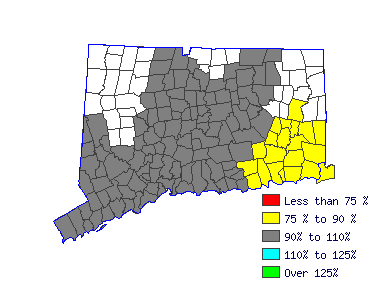
| Bridgeport-Stamford LMA (1Q 2016) |
| All Industry |
| Estimated employment | 1,510 |
| Mean wage | $25.70 |
| Entry wage | $17.29 |
| 10th percentile wage | $14.13 |
| 50th percentile wage | $26.34 |
| 90th percentile wage | $36.42 |
 | | Top Employing Industries |
| Industry | Employment / Percent |
| Construction | 1,290 | 85.1% |
| Education & Health Services | 30 | 1.8% |
| Public Administration | 30 | 1.7% |
| Manufacturing | | |
| Financial Activities | | |
 |
| Top Paying Industries |
| Industry | Employment / Median Wage |
| Education & Health Services | 30 | $32.92 |
| Public Administration | 30 | $29.69 |
| Construction | 1,290 | $26.71 |
| Manufacturing | | $18.67 |
| Financial Activities | | $17.37 |
 | |
 |
| Carpenters (47-2031) |
| Construct, erect, install, or repair structures and fixtures made of wood, such as concrete forms; building frameworks, including partitions, joists, studding, and rafters; wood stairways, window and door frames, and hardwood floors. May also install cabinets, siding, drywall and batt or roll insulation. Include brattice builders who build doors or brattices (ventilation walls or partitions) in underground passageways to control the proper circulation of air through the passageways and to the working places. |
 |
| Mean Wage History |
| Year | This
Occupation | Compared to
Occupational Group | Difference |
| Current | $26.34 | | $25.84 |
| $0.50 | | 2015 | $25.72 | +2.4% | $25.24 |
+2.4% | $0.49 | | 2014 | $25.17 | +2.2% | $24.69 |
+2.2% | $0.48 | | 2013 | $24.79 | +1.5% | $24.32 |
+1.5% | $0.47 | | 2012 | $24.58 | +.9% | $24.11 |
+.9% | $0.47 | | 2011 | $24.22 | +1.5% | $23.76 |
+1.5% | $0.46 | | 2010 | $23.94 | +1.2% | $23.49 |
+1.2% | $0.45 | | 2009 | $23.68 | +1.1% | $23.24 |
+1.1% | $0.45 | | 2008 | $22.90 | +3.4% | $22.46 |
+3.4% | $0.43 | | 2007 | $22.03 | +4.0% | $21.61 |
+4.0% | $0.42 |
| Year | This
Occupation | Compared to
All Occupations | Difference |
| Current | $26.34 | | $22.98 |
| $3.36 | | 2015 | $25.72 | +2.4% | $22.34 |
+2.9% | $3.39 | | 2014 | $25.17 | +2.2% | $21.86 |
+2.2% | $3.31 | | 2013 | $24.79 | +1.5% | $21.42 |
+2.1% | $3.37 | | 2012 | $24.58 | +.9% | $21.05 |
+1.7% | $3.53 | | 2011 | $24.22 | +1.5% | $20.72 |
+1.6% | $3.50 | | 2010 | $23.94 | +1.2% | $20.37 |
+1.7% | $3.57 | | 2009 | $23.68 | +1.1% | $20.10 |
+1.4% | $3.59 | | 2008 | $22.90 | +3.4% | $19.58 |
+2.6% | $3.32 | | 2007 | $22.03 | +4.0% | $18.96 |
+3.3% | $3.07 |
 |
|
| Reference Date: 1st Quarter 2016 |
| Top Areas For This Occupation |
|
|
|

| |


