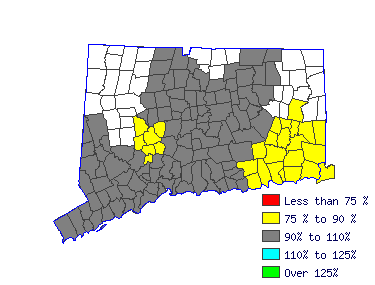
| Bridgeport-Stamford LMA (1Q 2016) |
| All Industry |
| Estimated employment | 8,400 |
| Mean wage | $18.61 |
| Entry wage | $11.82 |
| 10th percentile wage | $9.88 |
| 50th percentile wage | $17.78 |
| 90th percentile wage | $27.92 |
 | | Top Employing Industries |
| Industry | Employment / Percent |
| Education & Health Services | 2,010 | 23.9% |
| Professional & Business Services | 1,540 | 18.3% |
| Financial Activities | 1,530 | 18.2% |
| Trade, Transportation and Utilities | 1,350 | 16.1% |
| Construction | 580 | 6.9% |
 |
| Top Paying Industries |
| Industry | Employment / Median Wage |
| Public Administration | 460 | $20.87 |
| Manufacturing | 430 | $19.95 |
| Construction | 580 | $19.10 |
| Leisure and Hospitality | 160 | $18.18 |
| Professional & Business Services | 1,540 | $17.74 |
 | |
 |
| Office Clerks, General (43-9061) |
| Perform duties too varied and diverse to be classified in any specific office clerical occupation, requiring limited knowledge of office management systems and procedures. Clerical duties may be assigned in accordance with the office procedures of individual establishments and may include a combination of answering telephones, bookkeeping, typing or word processing, stenography, office machine operation, and filing. |
 |
| Mean Wage History |
| Year | This
Occupation | Compared to
Occupational Group | Difference |
| Current | $17.78 | | $19.88 |
| -$2.10 | | 2015 | $17.14 | +3.8% | $19.16 |
+3.8% | -$2.02 | | 2014 | $16.80 | +2.0% | $18.79 |
+2.0% | -$1.98 | | 2013 | $16.47 | +2.0% | $18.41 |
+2.0% | -$1.94 | | 2012 | $16.19 | +1.7% | $18.10 |
+1.7% | -$1.91 | | 2011 | $15.89 | +1.8% | $17.77 |
+1.8% | -$1.87 | | 2010 | $15.64 | +1.6% | $17.49 |
+1.6% | -$1.84 | | 2009 | $15.35 | +1.9% | $17.16 |
+1.9% | -$1.81 | | 2008 | $14.93 | +2.8% | $16.69 |
+2.8% | -$1.76 | | 2007 | $14.45 | +3.3% | $16.16 |
+3.3% | -$1.70 |
| Year | This
Occupation | Compared to
All Occupations | Difference |
| Current | $17.78 | | $22.98 |
| -$5.20 | | 2015 | $17.14 | +3.8% | $22.34 |
+2.9% | -$5.20 | | 2014 | $16.80 | +2.0% | $21.86 |
+2.2% | -$5.05 | | 2013 | $16.47 | +2.0% | $21.42 |
+2.1% | -$4.95 | | 2012 | $16.19 | +1.7% | $21.05 |
+1.7% | -$4.86 | | 2011 | $15.89 | +1.8% | $20.72 |
+1.6% | -$4.82 | | 2010 | $15.64 | +1.6% | $20.37 |
+1.7% | -$4.73 | | 2009 | $15.35 | +1.9% | $20.10 |
+1.4% | -$4.75 | | 2008 | $14.93 | +2.8% | $19.58 |
+2.6% | -$4.65 | | 2007 | $14.45 | +3.3% | $18.96 |
+3.3% | -$4.50 |
 |
|
| Reference Date: 1st Quarter 2016 |
| Top Areas For This Occupation |
|
|
|

| |


