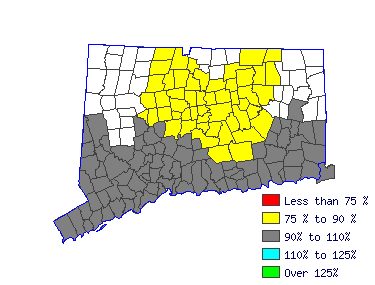
| Bridgeport-Stamford LMA (1Q 2016) |
| All Industry |
| Estimated employment | 4,950 |
| Mean wage | $34,259 |
| Entry wage | $23,729 |
| 10th percentile wage | $20,219 |
| 50th percentile wage | $32,991 |
| 90th percentile wage | $51,090 |
 | | Top Employing Industries |
| Industry | Employment / Percent |
| Education & Health Services | 5,060 | 102.3% |
 |
| Top Paying Industries |
| Industry | Employment / Median Wage |
| Education & Health Services | 5,060 | $33,153 |
 | |
 |
| Teacher Assistants (25-9041) |
| Perform duties that are instructional in nature or deliver direct services to students or parents. Serve in a position for which a teacher or another professional has ultimate responsibility for the design and implementation of educational programs and services. |
 |
| Mean Wage History |
| Year | This
Occupation | Compared to
Occupational Group | Difference |
| Current | $32991.30 | | $60910.14 |
| -$27918.84 | | 2015 | $32153.43 | +2.6% | $59363.22 |
+2.6% | -$27209.79 | | 2014 | $31551.20 | +1.9% | $58251.36 |
+1.9% | -$26700.16 | | 2013 | $30948.98 | +1.9% | $57139.51 |
+1.9% | -$26190.53 | | 2012 | $30346.76 | +2.0% | $56027.66 |
+2.0% | -$25680.90 | | 2011 | $29875.46 | +1.6% | $55157.52 |
+1.6% | -$25282.06 | | 2010 | $29351.78 | +1.8% | $54190.69 |
+1.8% | -$24838.90 | | 2009 | $29037.58 | +1.1% | $53610.59 |
+1.1% | -$24573.01 | | 2008 | $28173.52 | +3.1% | $52015.33 |
+3.1% | -$23841.80 | | 2007 | $27230.91 | +3.5% | $50275.04 |
+3.5% | -$23044.12 |
| Year | This
Occupation | Compared to
All Occupations | Difference |
| Current | $32991.30 | | $47820.98 |
| -$14829.68 | | 2015 | $32153.43 | +2.6% | $46483.06 |
+2.9% | -$14329.63 | | 2014 | $31551.20 | +1.9% | $45489.18 |
+2.2% | -$13937.97 | | 2013 | $30948.98 | +1.9% | $44571.75 |
+2.1% | -$13622.77 | | 2012 | $30346.76 | +2.0% | $43807.23 |
+1.7% | -$13460.46 | | 2011 | $29875.46 | +1.6% | $43119.16 |
+1.6% | -$13243.70 | | 2010 | $29351.78 | +1.8% | $42392.86 |
+1.7% | -$13041.07 | | 2009 | $29037.58 | +1.1% | $41819.47 |
+1.4% | -$12781.88 | | 2008 | $28173.52 | +3.1% | $40749.13 |
+2.6% | -$12575.60 | | 2007 | $27230.91 | +3.5% | $39449.44 |
+3.3% | -$12218.52 |
 |
|
| Reference Date: 1st Quarter 2016 |
| Top Areas For This Occupation |
|
| Highest Employment |
|
| Hartford |
$26,884 |
7,730 |
| Bridgeport |
$32,991 |
4,950 |
| New Haven |
$29,725 |
3,890 |
| Norwich-NL |
$32,312 |
1,630 |
| Waterbury |
$33,996 |
1,240 |
|
|

| |


