CT.Gov Home Connecticut LMI 1Q 2016 Connecticut Occupational Employment & Wages Home
Select Occupation
Bridgeport-Stamford LMA (1Q 2016)
All Industry
Estimated employment1,400
Mean wage$42.24
Entry wage$30.81
10th percentile wage$27.87
50th percentile wage$42.94
90th percentile wage$57.01
 Top Employing Industries
 IndustryEmployment / Percent
Professional & Business Services96069%
Financial Activities18012.8%
Trade, Transportation and Utilities1107.9%
Information906.3%
Manufacturing705%
Top Paying Industries
 IndustryEmployment / Median Wage
Information90$48.21
Professional & Business Services960$43.06
Financial Activities180$42.74
Trade, Transportation and Utilities110$42.02
Manufacturing70$40.28
Computer Programmers (15-1131)
Create, modify, and test the code, forms, and script that allow computer applications to run. Work from specifications drawn up by software developers or other individuals. May assist software developers by analyzing user needs and designing software solutions. May develop and write computer programs to store, locate, and retrieve specific documents, data, and information.
Mean Wage History
YearThis
Occupation
Compared to
Occupational Group
Difference
Current$42.94 $42.90  $0.04
2015$41.85+2.6%$41.81 +2.6%$0.04
2014$41.07+1.9%$41.03 +1.9%$0.04
2013$40.28+1.9%$40.24 +1.9%$0.04
2012$39.50+2.0%$39.46 +2.0%$0.04
2011$38.88+1.6%$38.85 +1.6%$0.04
2010$38.20+1.8%$38.17 +1.8%$0.04
2009$37.79+1.1%$37.76 +1.1%$0.04
2008$36.67+3.1%$36.64 +3.1%$0.03
2007$35.44+3.5%$35.41 +3.5%$0.03
YearThis
Occupation
Compared to
All Occupations
Difference
Current$42.94 $22.98  $19.96
2015$41.85+2.6%$22.34 +2.9%$19.51
2014$41.07+1.9%$21.86 +2.2%$19.21
2013$40.28+1.9%$21.42 +2.1%$18.86
2012$39.50+2.0%$21.05 +1.7%$18.45
2011$38.88+1.6%$20.72 +1.6%$18.16
2010$38.20+1.8%$20.37 +1.7%$17.83
2009$37.79+1.1%$20.10 +1.4%$17.70
2008$36.67+3.1%$19.58 +2.6%$17.09
2007$35.44+3.5%$18.96 +3.3%$16.49
Note: The mid-wage is the median wage. The average wage is the mean wage. The entry-level wage is equal to the average of the lower third of reported wages for the occupation. The wage range consists of the 10th and 90th percentiles; 80% of workers earn between this wage range, 10% earn less while 10% earn more.
Reference Date: 1st Quarter 2016
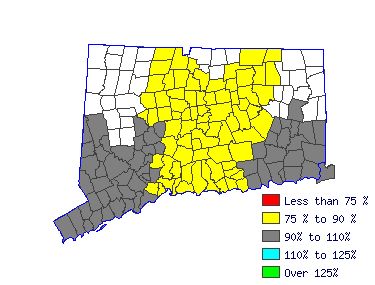
Top Areas For This Occupation
Best Pay
Median Wage / Employment
Norwich-NL $47.01 190
Bridgeport $42.94 1,400
Waterbury $42.03  
Danbury $39.58 230
New Haven $36.79 420
Highest Employment
Median Wage / Employment
Hartford $36.02 1,750
Bridgeport $42.94 1,400
New Haven $36.79 420
Danbury $39.58 230
Norwich-NL $47.01 190
Wages in other areas
Go Connecticut LMI Home State of Connecticut Department of Labor - Office of Research
200 Folly Brook Boulevard, Wethersfield, CT 06109 / Phone: 860-263-6285
LMI Home | CTDOL Home | CT.gov | Feedback | Disclaimer | Privacy Policy | Accessibility Policy
Go to the State of Connecticut website