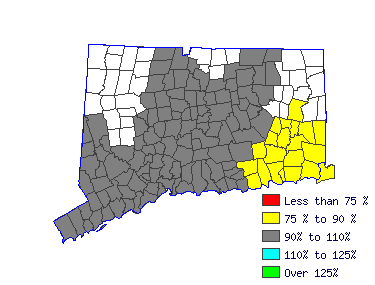
| Mean Wage History |
| Year | This Occupation | Compared to
Occupational Group | Difference |
| Current | $80123.81 | | $57086.44 |
| $23037.37 |
| 2014 | $79734.23 | +.5% | $56808.87 |
+.5% | $22925.36 |
| 2013 | $78240.84 | +1.9% | $55744.86 |
+1.9% | $22495.97 |
| 2012 | $76747.44 | +1.9% | $54680.85 |
+1.9% | $22066.59 |
| 2011 | $75254.05 | +2.0% | $53616.84 |
+2.0% | $21637.21 |
| 2010 | $74085.31 | +1.6% | $52784.14 |
+1.6% | $21301.17 |
| 2009 | $72786.70 | +1.8% | $51858.91 |
+1.8% | $20927.79 |
| 2008 | $72007.54 | +1.1% | $51303.78 |
+1.1% | $20703.76 |
| 2007 | $69864.85 | +3.1% | $49777.16 |
+3.1% | $20087.69 |
| 2006 | $67527.36 | +3.5% | $48111.75 |
+3.5% | $19415.61 |
| Year | This Occupation | Compared to
All Occupations | Difference |
| Current | $80123.81 | | $47062.91 |
| $33060.90 |
| 2014 | $79734.23 | +.5% | $46679.04 |
+.8% | $33055.19 |
| 2013 | $78240.84 | +1.9% | $45680.96 |
+2.2% | $32559.87 |
| 2012 | $76747.44 | +1.9% | $44759.67 |
+2.1% | $31987.77 |
| 2011 | $75254.05 | +2.0% | $43991.92 |
+1.7% | $31262.13 |
| 2010 | $74085.31 | +1.6% | $43300.95 |
+1.6% | $30784.36 |
| 2009 | $72786.70 | +1.8% | $42571.59 |
+1.7% | $30215.11 |
| 2008 | $72007.54 | +1.1% | $41995.78 |
+1.4% | $30011.76 |
| 2007 | $69864.85 | +3.1% | $40920.93 |
+2.6% | $28943.91 |
| 2006 | $67527.36 | +3.5% | $39615.76 |
+3.3% | $27911.60 |
|
Reference Date: 1st Quarter 2015 |
State of Connecticut Department of Labor Office of Research
200 Folly Brook Boulevard Wethersfield, CT 06109
Phone: 860-263-6285 |

| | | | |
| Top Areas For This Occupation |
|
|
|
 |


