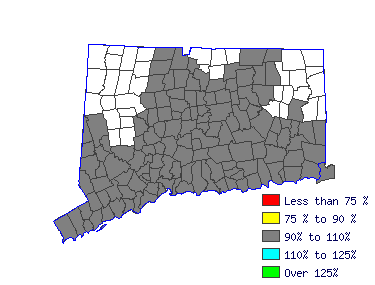
| Mean Wage History |
| Year | This Occupation | Compared to
Occupational Group | Difference |
| Current | $74425.31 | | $53517.27 |
| $20908.04 |
| 2014 | $74063.44 | +.5% | $53257.06 |
+.5% | $20806.38 |
| 2013 | $72676.25 | +1.9% | $52259.57 |
+1.9% | $20416.68 |
| 2012 | $71289.07 | +1.9% | $51262.09 |
+1.9% | $20026.99 |
| 2011 | $69901.89 | +2.0% | $50264.60 |
+2.0% | $19637.29 |
| 2010 | $68816.27 | +1.6% | $49483.96 |
+1.6% | $19332.31 |
| 2009 | $67610.03 | +1.8% | $48616.58 |
+1.8% | $18993.45 |
| 2008 | $66886.28 | +1.1% | $48096.15 |
+1.1% | $18790.13 |
| 2007 | $64895.98 | +3.1% | $46664.98 |
+3.1% | $18231.00 |
| 2006 | $62724.73 | +3.5% | $45103.70 |
+3.5% | $17621.04 |
| Year | This Occupation | Compared to
All Occupations | Difference |
| Current | $74425.31 | | $51791.62 |
| $22633.69 |
| 2014 | $74063.44 | +.5% | $51369.18 |
+.8% | $22694.26 |
| 2013 | $72676.25 | +1.9% | $50270.82 |
+2.2% | $22405.43 |
| 2012 | $71289.07 | +1.9% | $49256.96 |
+2.1% | $22032.12 |
| 2011 | $69901.89 | +2.0% | $48412.07 |
+1.7% | $21489.82 |
| 2010 | $68816.27 | +1.6% | $47651.67 |
+1.6% | $21164.60 |
| 2009 | $67610.03 | +1.8% | $46849.03 |
+1.7% | $20761.00 |
| 2008 | $66886.28 | +1.1% | $46215.36 |
+1.4% | $20670.92 |
| 2007 | $64895.98 | +3.1% | $45032.52 |
+2.6% | $19863.46 |
| 2006 | $62724.73 | +3.5% | $43596.21 |
+3.3% | $19128.53 |
|
Reference Date: 1st Quarter 2015 |
State of Connecticut Department of Labor Office of Research
200 Folly Brook Boulevard Wethersfield, CT 06109
Phone: 860-263-6285 |

| | | | |
| Top Areas For This Occupation |
|
|
|
 |


