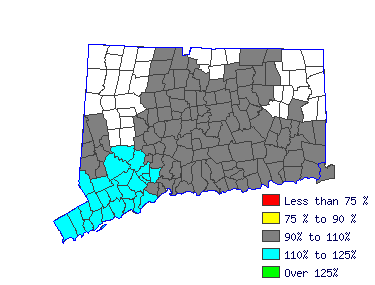
| Norwich-New London Labor Market Area (1Q 2015) |
| All Industry |
| Estimated employment | 1,240 |
| Mean wage | $66,658 |
| Entry wage | $48,437 |
| 10th percentile wage | $44,381 |
| 50th percentile wage | $66,922 |
| 90th percentile wage | $92,575 |
 | | Top Employing Industries |
| Industry | Employment | % |
| Education & Health Services | 1,120 | 90.7% |
 |
| Best Paying Industries |
| Industry | Employment | Median
Wage |
| Education & Health Services | 1,120 | 66,204 |
 | |
 |
| Elementary School Teachers, Except Special Education (25-2021) |
| Teach pupils in public or private schools at the elementary level basic academic, social, and other formative skills. Exclude "Special Education Teachers" (25-2041 through 25-2043). |
| Mean Wage History |
| Year | This Occupation | Compared to
Occupational Group | Difference |
| Current | $66658.31 | | $57137.14 |
| $9521.17 | | 2014 | $66334.20 | +.5% | $56859.33 |
+.5% | $9474.88 | | 2013 | $65091.79 | +1.9% | $55794.37 |
+1.9% | $9297.41 | | 2012 | $63849.37 | +1.9% | $54729.42 |
+1.9% | $9119.95 | | 2011 | $62606.95 | +2.0% | $53664.46 |
+2.0% | $8942.49 | | 2010 | $61634.63 | +1.6% | $52831.02 |
+1.6% | $8803.61 | | 2009 | $60554.27 | +1.8% | $51904.97 |
+1.8% | $8649.30 | | 2008 | $59906.05 | +1.1% | $51349.34 |
+1.1% | $8556.71 | | 2007 | $58123.45 | +3.1% | $49821.36 |
+3.1% | $8302.09 | | 2006 | $56178.80 | +3.5% | $48154.48 |
+3.5% | $8024.32 |
| Year | This Occupation | Compared to
All Occupations | Difference |
| Current | $66658.31 | | $49386.50 |
| $17271.81 | | 2014 | $66334.20 | +.5% | $48983.67 |
+.8% | $17350.53 | | 2013 | $65091.79 | +1.9% | $47936.33 |
+2.2% | $17155.46 | | 2012 | $63849.37 | +1.9% | $46969.54 |
+2.1% | $16879.83 | | 2011 | $62606.95 | +2.0% | $46163.89 |
+1.7% | $16443.06 | | 2010 | $61634.63 | +1.6% | $45438.80 |
+1.6% | $16195.83 | | 2009 | $60554.27 | +1.8% | $44673.43 |
+1.7% | $15880.83 | | 2008 | $59906.05 | +1.1% | $44069.19 |
+1.4% | $15836.86 | | 2007 | $58123.45 | +3.1% | $42941.28 |
+2.6% | $15182.17 | | 2006 | $56178.80 | +3.5% | $41571.67 |
+3.3% | $14607.13 |
|
Reference Date: 1st Quarter 2015 |
State of Connecticut Department of Labor Office of Research
200 Folly Brook Boulevard Wethersfield, CT 06109
Phone: 860-263-6285 |

| | | | |
| Top Areas For This Occupation |
|
|
|
 |
|


