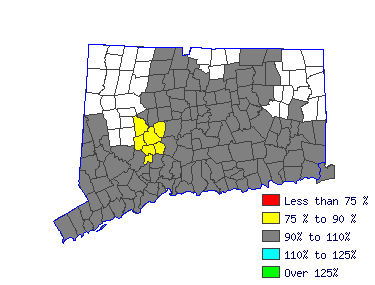
| Mean Wage History |
| Year | This Occupation | Compared to
Occupational Group | Difference |
| Current | $125813.25 | | $115582.30 |
| $10230.95 |
| 2014 | $125099.56 | +.6% | $114926.65 |
+.6% | $10172.91 |
| 2013 | $122142.85 | +2.4% | $112210.37 |
+2.4% | $9932.48 |
| 2012 | $119186.13 | +2.5% | $109494.09 |
+2.5% | $9692.04 |
| 2011 | $117248.98 | +1.7% | $107714.46 |
+1.7% | $9534.52 |
| 2010 | $115413.78 | +1.6% | $106028.50 |
+1.6% | $9385.28 |
| 2009 | $112966.84 | +2.2% | $103780.54 |
+2.2% | $9186.30 |
| 2008 | $112151.20 | +.7% | $103031.22 |
+.7% | $9119.97 |
| 2007 | $108684.70 | +3.2% | $99846.62 |
+3.2% | $8838.08 |
| 2006 | $105116.26 | +3.4% | $96568.36 |
+3.4% | $8547.90 |
| Year | This Occupation | Compared to
All Occupations | Difference |
| Current | $125813.25 | | $49386.50 |
| $76426.75 |
| 2014 | $125099.56 | +.6% | $48983.67 |
+.8% | $76115.89 |
| 2013 | $122142.85 | +2.4% | $47936.33 |
+2.2% | $74206.52 |
| 2012 | $119186.13 | +2.5% | $46969.54 |
+2.1% | $72216.59 |
| 2011 | $117248.98 | +1.7% | $46163.89 |
+1.7% | $71085.09 |
| 2010 | $115413.78 | +1.6% | $45438.80 |
+1.6% | $69974.97 |
| 2009 | $112966.84 | +2.2% | $44673.43 |
+1.7% | $68293.41 |
| 2008 | $112151.20 | +.7% | $44069.19 |
+1.4% | $68082.00 |
| 2007 | $108684.70 | +3.2% | $42941.28 |
+2.6% | $65743.42 |
| 2006 | $105116.26 | +3.4% | $41571.67 |
+3.3% | $63544.59 |
|
Reference Date: 1st Quarter 2015 |
State of Connecticut Department of Labor Office of Research
200 Folly Brook Boulevard Wethersfield, CT 06109
Phone: 860-263-6285 |

| | | | |
| Top Areas For This Occupation |
|
|
|
 |


