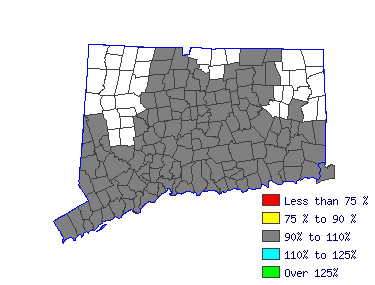
| Mean Wage History |
| Year | This Occupation | Compared to
Occupational Group | Difference |
| Current | $74617.96 | | $71089.35 |
| $3528.61 |
| 2014 | $74255.15 | +.5% | $70743.70 |
+.5% | $3511.45 |
| 2013 | $72864.38 | +1.9% | $69418.69 |
+1.9% | $3445.68 |
| 2012 | $71473.61 | +1.9% | $68093.69 |
+1.9% | $3379.92 |
| 2011 | $70082.83 | +2.0% | $66768.68 |
+2.0% | $3314.15 |
| 2010 | $68994.40 | +1.6% | $65731.72 |
+1.6% | $3262.68 |
| 2009 | $67785.03 | +1.8% | $64579.55 |
+1.8% | $3205.49 |
| 2008 | $67059.41 | +1.1% | $63888.24 |
+1.1% | $3171.17 |
| 2007 | $65063.96 | +3.1% | $61987.15 |
+3.1% | $3076.81 |
| 2006 | $62887.10 | +3.5% | $59913.23 |
+3.5% | $2973.87 |
| Year | This Occupation | Compared to
All Occupations | Difference |
| Current | $74617.96 | | $54369.99 |
| $20247.97 |
| 2014 | $74255.15 | +.5% | $53926.52 |
+.8% | $20328.63 |
| 2013 | $72864.38 | +1.9% | $52773.48 |
+2.2% | $20090.90 |
| 2012 | $71473.61 | +1.9% | $51709.14 |
+2.1% | $19764.46 |
| 2011 | $70082.83 | +2.0% | $50822.19 |
+1.7% | $19260.64 |
| 2010 | $68994.40 | +1.6% | $50023.94 |
+1.6% | $18970.46 |
| 2009 | $67785.03 | +1.8% | $49181.34 |
+1.7% | $18603.70 |
| 2008 | $67059.41 | +1.1% | $48516.12 |
+1.4% | $18543.29 |
| 2007 | $65063.96 | +3.1% | $47274.40 |
+2.6% | $17789.56 |
| 2006 | $62887.10 | +3.5% | $45766.58 |
+3.3% | $17120.52 |
|
Reference Date: 1st Quarter 2015 |
State of Connecticut Department of Labor Office of Research
200 Folly Brook Boulevard Wethersfield, CT 06109
Phone: 860-263-6285 |

| | | | |
| Top Areas For This Occupation |
|
|
|
 |


