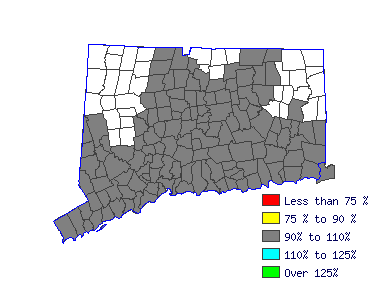
| Mean Wage History |
| Year | This Occupation | Compared to
Occupational Group | Difference |
| Current | $73847.35 | | $53517.27 |
| $20330.08 |
| 2014 | $73488.29 | +.5% | $53257.06 |
+.5% | $20231.23 |
| 2013 | $72111.88 | +1.9% | $52259.57 |
+1.9% | $19852.31 |
| 2012 | $70735.47 | +1.9% | $51262.09 |
+1.9% | $19473.38 |
| 2011 | $69359.06 | +2.0% | $50264.60 |
+2.0% | $19094.46 |
| 2010 | $68281.87 | +1.6% | $49483.96 |
+1.6% | $18797.91 |
| 2009 | $67084.99 | +1.8% | $48616.58 |
+1.8% | $18468.41 |
| 2008 | $66366.86 | +1.1% | $48096.15 |
+1.1% | $18270.71 |
| 2007 | $64392.02 | +3.1% | $46664.98 |
+3.1% | $17727.04 |
| 2006 | $62237.64 | +3.5% | $45103.70 |
+3.5% | $17133.94 |
| Year | This Occupation | Compared to
All Occupations | Difference |
| Current | $73847.35 | | $51791.62 |
| $22055.73 |
| 2014 | $73488.29 | +.5% | $51369.18 |
+.8% | $22119.11 |
| 2013 | $72111.88 | +1.9% | $50270.82 |
+2.2% | $21841.06 |
| 2012 | $70735.47 | +1.9% | $49256.96 |
+2.1% | $21478.51 |
| 2011 | $69359.06 | +2.0% | $48412.07 |
+1.7% | $20946.99 |
| 2010 | $68281.87 | +1.6% | $47651.67 |
+1.6% | $20630.20 |
| 2009 | $67084.99 | +1.8% | $46849.03 |
+1.7% | $20235.96 |
| 2008 | $66366.86 | +1.1% | $46215.36 |
+1.4% | $20151.50 |
| 2007 | $64392.02 | +3.1% | $45032.52 |
+2.6% | $19359.50 |
| 2006 | $62237.64 | +3.5% | $43596.21 |
+3.3% | $18641.43 |
|
Reference Date: 1st Quarter 2015 |
State of Connecticut Department of Labor Office of Research
200 Folly Brook Boulevard Wethersfield, CT 06109
Phone: 860-263-6285 |

| | | | |
| Top Areas For This Occupation |
|
|
|
 |


