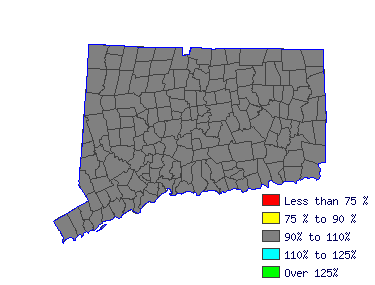
| Southwest Workforce Investment Area (1Q 2015) |
| All Industry |
| Estimated employment | 4,170 |
| Mean wage | $30,744 |
| Entry wage | $21,366 |
| 10th percentile wage | $19,662 |
| 50th percentile wage | $29,338 |
| 90th percentile wage | $44,405 |
 | | Top Employing Industries |
| Industry | Employment | % |
| Education & Health Services | 4,110 | 98.5% |
| Leisure and Hospitality | 10 | 0.3% |
 |
| Best Paying Industries |
| Industry | Employment | Median
Wage |
| Education & Health Services | 4,110 | 30,805 |
| Leisure and Hospitality | 10 | 26,619 |
 | |
 |
| Teacher Assistants (25-9041) |
| Perform duties that are instructional in nature or deliver direct services to students or parents. Serve in a position for which a teacher or another professional has ultimate responsibility for the design and implementation of educational programs and services. |
| Mean Wage History |
| Year | This Occupation | Compared to
Occupational Group | Difference |
| Current | $30743.53 | | $59890.07 |
| -$29146.54 | | 2014 | $30594.05 | +.5% | $59598.87 |
+.5% | -$29004.82 | | 2013 | $30021.03 | +1.9% | $58482.60 |
+1.9% | -$28461.57 | | 2012 | $29448.02 | +1.9% | $57366.34 |
+1.9% | -$27918.32 | | 2011 | $28875.00 | +2.0% | $56250.07 |
+2.0% | -$27375.07 | | 2010 | $28426.55 | +1.6% | $55376.47 |
+1.6% | -$26949.92 | | 2009 | $27928.28 | +1.8% | $54405.81 |
+1.8% | -$26477.52 | | 2008 | $27629.32 | +1.1% | $53823.41 |
+1.1% | -$26194.09 | | 2007 | $26807.16 | +3.1% | $52221.81 |
+3.1% | -$25414.64 | | 2006 | $25910.27 | +3.5% | $50474.61 |
+3.5% | -$24564.34 |
| Year | This Occupation | Compared to
All Occupations | Difference |
| Current | $30743.53 | | $63821.30 |
| -$33077.77 | | 2014 | $30594.05 | +.5% | $63300.73 |
+.8% | -$32706.68 | | 2013 | $30021.03 | +1.9% | $61947.27 |
+2.2% | -$31926.23 | | 2012 | $29448.02 | +1.9% | $60697.91 |
+2.1% | -$31249.89 | | 2011 | $28875.00 | +2.0% | $59656.78 |
+1.7% | -$30781.77 | | 2010 | $28426.55 | +1.6% | $58719.76 |
+1.6% | -$30293.20 | | 2009 | $27928.28 | +1.8% | $57730.69 |
+1.7% | -$29802.40 | | 2008 | $27629.32 | +1.1% | $56949.84 |
+1.4% | -$29320.52 | | 2007 | $26807.16 | +3.1% | $55492.26 |
+2.6% | -$28685.09 | | 2006 | $25910.27 | +3.5% | $53722.33 |
+3.3% | -$27812.06 |
|
Reference Date: 1st Quarter 2015 |
State of Connecticut Department of Labor Office of Research
200 Folly Brook Boulevard Wethersfield, CT 06109
Phone: 860-263-6285 |

| | | | |
| Top Areas For This Occupation |
| Best Pay |
| Eastern |
32,311 |
2,730 |
| Northwest |
30,928 |
2,740 |
| Southwest |
30,744 |
4,170 |
| South Central |
29,149 |
4,280 |
| North Central |
28,665 |
6,580 |
|
| Highest Employment |
| North Central |
28,665 |
6,580 |
| South Central |
29,149 |
4,280 |
| Southwest |
30,744 |
4,170 |
| Northwest |
30,928 |
2,740 |
| Eastern |
32,311 |
2,730 |
|
|
 |
|


