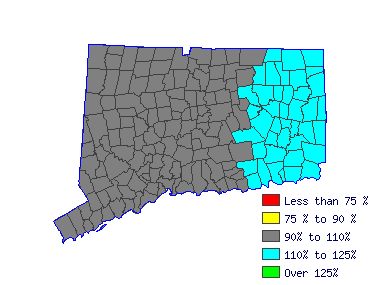
| North Central Workforce Investment Area (1Q 2015) |
| All Industry |
| Estimated employment | 6,580 |
| Mean wage | $28,665 |
| Entry wage | $20,930 |
| 10th percentile wage | $19,509 |
| 50th percentile wage | $26,976 |
| 90th percentile wage | $40,677 |
 | | Top Employing Industries |
| Industry | Employment | % |
| Education & Health Services | 6,490 | 98.5% |
 |
| Best Paying Industries |
| Industry | Employment | Median
Wage |
| Education & Health Services | 6,490 | 28,627 |
 | |
 |
| Teacher Assistants (25-9041) |
| Perform duties that are instructional in nature or deliver direct services to students or parents. Serve in a position for which a teacher or another professional has ultimate responsibility for the design and implementation of educational programs and services. |
| Mean Wage History |
| Year | This Occupation | Compared to
Occupational Group | Difference |
| Current | $28664.90 | | $59318.19 |
| -$30653.29 | | 2014 | $28525.52 | +.5% | $59029.77 |
+.5% | -$30504.24 | | 2013 | $27991.25 | +1.9% | $57924.16 |
+1.9% | -$29932.91 | | 2012 | $27456.98 | +1.9% | $56818.56 |
+1.9% | -$29361.57 | | 2011 | $26922.71 | +2.0% | $55712.95 |
+2.0% | -$28790.24 | | 2010 | $26504.58 | +1.6% | $54847.69 |
+1.6% | -$28343.11 | | 2009 | $26039.99 | +1.8% | $53886.30 |
+1.8% | -$27846.30 | | 2008 | $25761.24 | +1.1% | $53309.46 |
+1.1% | -$27548.21 | | 2007 | $24994.68 | +3.1% | $51723.15 |
+3.1% | -$26728.47 | | 2006 | $24158.42 | +3.5% | $49992.64 |
+3.5% | -$25834.21 |
| Year | This Occupation | Compared to
All Occupations | Difference |
| Current | $28664.90 | | $56151.41 |
| -$27486.51 | | 2014 | $28525.52 | +.5% | $55693.41 |
+.8% | -$27167.88 | | 2013 | $27991.25 | +1.9% | $54502.59 |
+2.2% | -$26511.34 | | 2012 | $27456.98 | +1.9% | $53403.38 |
+2.1% | -$25946.40 | | 2011 | $26922.71 | +2.0% | $52487.37 |
+1.7% | -$25564.66 | | 2010 | $26504.58 | +1.6% | $51662.96 |
+1.6% | -$25158.38 | | 2009 | $26039.99 | +1.8% | $50792.75 |
+1.7% | -$24752.75 | | 2008 | $25761.24 | +1.1% | $50105.74 |
+1.4% | -$24344.50 | | 2007 | $24994.68 | +3.1% | $48823.33 |
+2.6% | -$23828.65 | | 2006 | $24158.42 | +3.5% | $47266.11 |
+3.3% | -$23107.68 |
|
Reference Date: 1st Quarter 2015 |
State of Connecticut Department of Labor Office of Research
200 Folly Brook Boulevard Wethersfield, CT 06109
Phone: 860-263-6285 |

| | | | |
| Top Areas For This Occupation |
| Best Pay |
| Eastern |
32,311 |
2,730 |
| Northwest |
30,928 |
2,740 |
| Southwest |
30,744 |
4,170 |
| South Central |
29,149 |
4,280 |
| North Central |
28,665 |
6,580 |
|
| Highest Employment |
| North Central |
28,665 |
6,580 |
| South Central |
29,149 |
4,280 |
| Southwest |
30,744 |
4,170 |
| Northwest |
30,928 |
2,740 |
| Eastern |
32,311 |
2,730 |
|
|
 |
|


