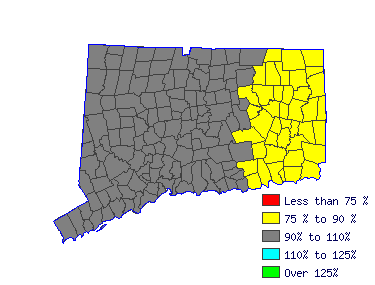
| Southwest Workforce Investment Area (1Q 2015) |
| All Industry |
| Estimated employment | 4,170 |
| Mean wage | $75,275 |
| Entry wage | $53,835 |
| 10th percentile wage | $50,550 |
| 50th percentile wage | $75,850 |
| 90th percentile wage | $101,782 |
 | | Top Employing Industries |
| Industry | Employment | % |
| Education & Health Services | 4,170 | 100.0% |
 |
| Best Paying Industries |
| Industry | Employment | Median
Wage |
| Education & Health Services | 4,170 | 75,275 |
 | |
 |
| Elementary School Teachers, Except Special Education (25-2021) |
| Teach pupils in public or private schools at the elementary level basic academic, social, and other formative skills. Exclude "Special Education Teachers" (25-2041 through 25-2043). |
| Mean Wage History |
| Year | This Occupation | Compared to
Occupational Group | Difference |
| Current | $75275.01 | | $59890.07 |
| $15384.94 | | 2014 | $74909.01 | +.5% | $59598.87 |
+.5% | $15310.13 | | 2013 | $73505.99 | +1.9% | $58482.60 |
+1.9% | $15023.38 | | 2012 | $72102.97 | +1.9% | $57366.34 |
+1.9% | $14736.63 | | 2011 | $70699.95 | +2.0% | $56250.07 |
+2.0% | $14449.87 | | 2010 | $69601.93 | +1.6% | $55376.47 |
+1.6% | $14225.46 | | 2009 | $68381.92 | +1.8% | $54405.81 |
+1.8% | $13976.11 | | 2008 | $67649.91 | +1.1% | $53823.41 |
+1.1% | $13826.50 | | 2007 | $65636.88 | +3.1% | $52221.81 |
+3.1% | $13415.07 | | 2006 | $63440.85 | +3.5% | $50474.61 |
+3.5% | $12966.24 |
| Year | This Occupation | Compared to
All Occupations | Difference |
| Current | $75275.01 | | $63821.30 |
| $11453.71 | | 2014 | $74909.01 | +.5% | $63300.73 |
+.8% | $11608.27 | | 2013 | $73505.99 | +1.9% | $61947.27 |
+2.2% | $11558.72 | | 2012 | $72102.97 | +1.9% | $60697.91 |
+2.1% | $11405.06 | | 2011 | $70699.95 | +2.0% | $59656.78 |
+1.7% | $11043.17 | | 2010 | $69601.93 | +1.6% | $58719.76 |
+1.6% | $10882.17 | | 2009 | $68381.92 | +1.8% | $57730.69 |
+1.7% | $10651.23 | | 2008 | $67649.91 | +1.1% | $56949.84 |
+1.4% | $10700.07 | | 2007 | $65636.88 | +3.1% | $55492.26 |
+2.6% | $10144.62 | | 2006 | $63440.85 | +3.5% | $53722.33 |
+3.3% | $9718.52 |
|
Reference Date: 1st Quarter 2015 |
State of Connecticut Department of Labor Office of Research
200 Folly Brook Boulevard Wethersfield, CT 06109
Phone: 860-263-6285 |

| | | | |
| Top Areas For This Occupation |
| Best Pay |
| Southwest |
75,275 |
4,170 |
| North Central |
72,513 |
4,790 |
| Northwest |
70,161 |
2,940 |
| South Central |
70,075 |
2,830 |
| Eastern |
67,316 |
1,810 |
|
| Highest Employment |
| North Central |
72,513 |
4,790 |
| Southwest |
75,275 |
4,170 |
| Northwest |
70,161 |
2,940 |
| South Central |
70,075 |
2,830 |
| Eastern |
67,316 |
1,810 |
|
|
 |
|


