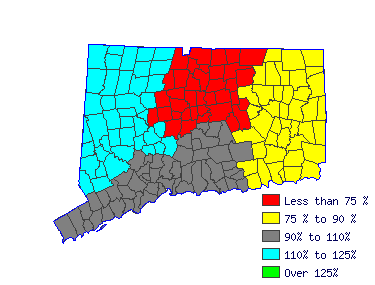
| Mean Wage History |
| Year | This Occupation | Compared to
Occupational Group | Difference |
| Current | $43397.86 | | $121939.88 |
| -$78542.02 |
| 2014 | $43151.68 | +.6% | $121248.16 |
+.6% | -$78096.48 |
| 2013 | $42131.80 | +2.4% | $118382.48 |
+2.4% | -$76250.68 |
| 2012 | $41111.91 | +2.5% | $115516.79 |
+2.5% | -$74404.87 |
| 2011 | $40443.71 | +1.7% | $113639.27 |
+1.7% | -$73195.56 |
| 2010 | $39810.68 | +1.6% | $111860.57 |
+1.6% | -$72049.89 |
| 2009 | $38966.64 | +2.2% | $109488.97 |
+2.2% | -$70522.33 |
| 2008 | $38685.29 | +.7% | $108698.43 |
+.7% | -$70013.14 |
| 2007 | $37489.56 | +3.2% | $105338.66 |
+3.2% | -$67849.10 |
| 2006 | $36258.67 | +3.4% | $101880.08 |
+3.4% | -$65621.41 |
| Year | This Occupation | Compared to
All Occupations | Difference |
| Current | $43397.86 | | $54046.93 |
| -$10649.07 |
| 2014 | $43151.68 | +.6% | $53606.09 |
+.8% | -$10454.40 |
| 2013 | $42131.80 | +2.4% | $52459.91 |
+2.2% | -$10328.11 |
| 2012 | $41111.91 | +2.5% | $51401.89 |
+2.1% | -$10289.98 |
| 2011 | $40443.71 | +1.7% | $50520.21 |
+1.7% | -$10076.50 |
| 2010 | $39810.68 | +1.6% | $49726.70 |
+1.6% | -$9916.02 |
| 2009 | $38966.64 | +2.2% | $48889.11 |
+1.7% | -$9922.47 |
| 2008 | $38685.29 | +.7% | $48227.85 |
+1.4% | -$9542.55 |
| 2007 | $37489.56 | +3.2% | $46993.50 |
+2.6% | -$9503.93 |
| 2006 | $36258.67 | +3.4% | $45494.64 |
+3.3% | -$9235.97 |
|
Reference Date: 1st Quarter 2015 |
State of Connecticut Department of Labor Office of Research
200 Folly Brook Boulevard Wethersfield, CT 06109
Phone: 860-263-6285 |

| | | | |
| Top Areas For This Occupation |
|
|
|
 |


