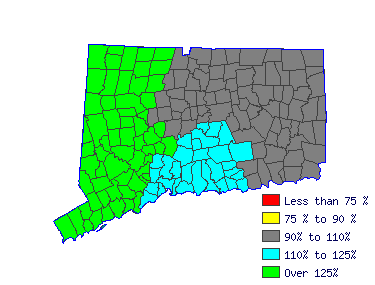
| Mean Wage History |
| Year | This Occupation | Compared to
Occupational Group | Difference |
| Current | $35571.04 | | $110291.41 |
| -$74720.37 |
| 2014 | $35369.26 | +.6% | $109665.77 |
+.6% | -$74296.51 |
| 2013 | $34533.31 | +2.4% | $107073.83 |
+2.4% | -$72540.52 |
| 2012 | $33697.36 | +2.5% | $104481.89 |
+2.5% | -$70784.53 |
| 2011 | $33149.67 | +1.7% | $102783.73 |
+1.7% | -$69634.05 |
| 2010 | $32630.81 | +1.6% | $101174.94 |
+1.6% | -$68544.13 |
| 2009 | $31938.99 | +2.2% | $99029.89 |
+2.2% | -$67090.89 |
| 2008 | $31708.38 | +.7% | $98314.87 |
+.7% | -$66606.48 |
| 2007 | $30728.31 | +3.2% | $95276.05 |
+3.2% | -$64547.74 |
| 2006 | $29719.40 | +3.4% | $92147.85 |
+3.4% | -$62428.44 |
| Year | This Occupation | Compared to
All Occupations | Difference |
| Current | $35571.04 | | $51120.02 |
| -$15548.98 |
| 2014 | $35369.26 | +.6% | $50703.05 |
+.8% | -$15333.79 |
| 2013 | $34533.31 | +2.4% | $49618.94 |
+2.2% | -$15085.63 |
| 2012 | $33697.36 | +2.5% | $48618.22 |
+2.1% | -$14920.86 |
| 2011 | $33149.67 | +1.7% | $47784.29 |
+1.7% | -$14634.62 |
| 2010 | $32630.81 | +1.6% | $47033.75 |
+1.6% | -$14402.94 |
| 2009 | $31938.99 | +2.2% | $46241.52 |
+1.7% | -$14302.52 |
| 2008 | $31708.38 | +.7% | $45616.07 |
+1.4% | -$13907.68 |
| 2007 | $30728.31 | +3.2% | $44448.57 |
+2.6% | -$13720.26 |
| 2006 | $29719.40 | +3.4% | $43030.88 |
+3.3% | -$13311.47 |
|
Reference Date: 1st Quarter 2015 |
State of Connecticut Department of Labor Office of Research
200 Folly Brook Boulevard Wethersfield, CT 06109
Phone: 860-263-6285 |

| | | | |
| Top Areas For This Occupation |
|
|
|
 |


