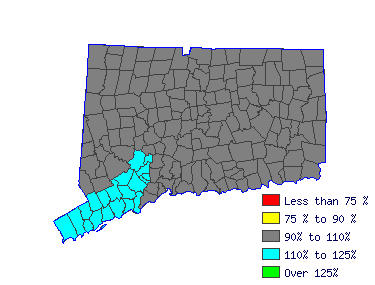
| Mean Wage History |
| Year | This Occupation | Compared to
Occupational Group | Difference |
| Current | $112393.37 | | $121636.71 |
| -$9243.34 |
| 2014 | $111755.81 | +.6% | $120946.71 |
+.6% | -$9190.90 |
| 2013 | $109114.47 | +2.4% | $118088.15 |
+2.4% | -$8973.68 |
| 2012 | $106473.14 | +2.5% | $115229.59 |
+2.5% | -$8756.45 |
| 2011 | $104742.61 | +1.7% | $113356.74 |
+1.7% | -$8614.13 |
| 2010 | $103103.16 | +1.6% | $111582.46 |
+1.6% | -$8479.30 |
| 2009 | $100917.22 | +2.2% | $109216.75 |
+2.2% | -$8299.53 |
| 2008 | $100188.58 | +.7% | $108428.19 |
+.7% | -$8239.60 |
| 2007 | $97091.84 | +3.2% | $105076.77 |
+3.2% | -$7984.92 |
| 2006 | $93904.02 | +3.4% | $101626.78 |
+3.4% | -$7722.75 |
| Year | This Occupation | Compared to
All Occupations | Difference |
| Current | $112393.37 | | $50965.12 |
| $61428.25 |
| 2014 | $111755.81 | +.6% | $50549.42 |
+.8% | $61206.39 |
| 2013 | $109114.47 | +2.4% | $49468.59 |
+2.2% | $59645.88 |
| 2012 | $106473.14 | +2.5% | $48470.91 |
+2.1% | $58002.23 |
| 2011 | $104742.61 | +1.7% | $47639.50 |
+1.7% | $57103.11 |
| 2010 | $103103.16 | +1.6% | $46891.24 |
+1.6% | $56211.92 |
| 2009 | $100917.22 | +2.2% | $46101.40 |
+1.7% | $54815.82 |
| 2008 | $100188.58 | +.7% | $45477.85 |
+1.4% | $54710.73 |
| 2007 | $97091.84 | +3.2% | $44313.88 |
+2.6% | $52777.96 |
| 2006 | $93904.02 | +3.4% | $42900.49 |
+3.3% | $51003.53 |
|
Reference Date: 1st Quarter 2015 |
State of Connecticut Department of Labor Office of Research
200 Folly Brook Boulevard Wethersfield, CT 06109
Phone: 860-263-6285 |

| | | | |
| Top Areas For This Occupation |
|
|
|
 |


