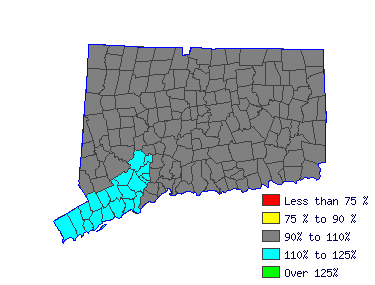
| Mean Wage History |
| Year | This Occupation | Compared to
Occupational Group | Difference |
| Current | $111582.19 | | $110291.41 |
| $1290.78 |
| 2014 | $110949.23 | +.6% | $109665.77 |
+.6% | $1283.46 |
| 2013 | $108326.96 | +2.4% | $107073.83 |
+2.4% | $1253.12 |
| 2012 | $105704.68 | +2.5% | $104481.89 |
+2.5% | $1222.79 |
| 2011 | $103986.64 | +1.7% | $102783.73 |
+1.7% | $1202.91 |
| 2010 | $102359.03 | +1.6% | $101174.94 |
+1.6% | $1184.09 |
| 2009 | $100188.87 | +2.2% | $99029.89 |
+2.2% | $1158.98 |
| 2008 | $99465.49 | +.7% | $98314.87 |
+.7% | $1150.61 |
| 2007 | $96391.10 | +3.2% | $95276.05 |
+3.2% | $1115.05 |
| 2006 | $93226.29 | +3.4% | $92147.85 |
+3.4% | $1078.44 |
| Year | This Occupation | Compared to
All Occupations | Difference |
| Current | $111582.19 | | $51120.02 |
| $60462.17 |
| 2014 | $110949.23 | +.6% | $50703.05 |
+.8% | $60246.17 |
| 2013 | $108326.96 | +2.4% | $49618.94 |
+2.2% | $58708.01 |
| 2012 | $105704.68 | +2.5% | $48618.22 |
+2.1% | $57086.46 |
| 2011 | $103986.64 | +1.7% | $47784.29 |
+1.7% | $56202.35 |
| 2010 | $102359.03 | +1.6% | $47033.75 |
+1.6% | $55325.27 |
| 2009 | $100188.87 | +2.2% | $46241.52 |
+1.7% | $53947.35 |
| 2008 | $99465.49 | +.7% | $45616.07 |
+1.4% | $53849.42 |
| 2007 | $96391.10 | +3.2% | $44448.57 |
+2.6% | $51942.53 |
| 2006 | $93226.29 | +3.4% | $43030.88 |
+3.3% | $50195.41 |
|
Reference Date: 1st Quarter 2015 |
State of Connecticut Department of Labor Office of Research
200 Folly Brook Boulevard Wethersfield, CT 06109
Phone: 860-263-6285 |

| | | | |
| Top Areas For This Occupation |
|
|
|
 |


