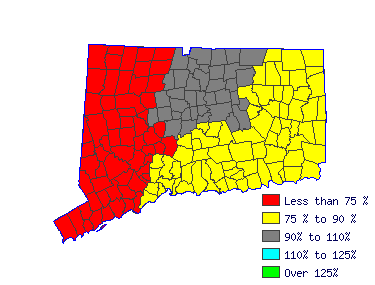
| Mean Wage History |
| Year | This Occupation | Compared to
Occupational Group | Difference |
| Current | $109556.28 | | $59318.19 |
| $50238.09 |
| 2014 | $109023.59 | +.5% | $59029.77 |
+.5% | $49993.82 |
| 2013 | $106981.62 | +1.9% | $57924.16 |
+1.9% | $49057.45 |
| 2012 | $104939.65 | +1.9% | $56818.56 |
+1.9% | $48121.09 |
| 2011 | $102897.67 | +2.0% | $55712.95 |
+2.0% | $47184.72 |
| 2010 | $101299.61 | +1.6% | $54847.69 |
+1.6% | $46451.91 |
| 2009 | $99523.98 | +1.8% | $53886.30 |
+1.8% | $45637.68 |
| 2008 | $98458.60 | +1.1% | $53309.46 |
+1.1% | $45149.14 |
| 2007 | $95528.81 | +3.1% | $51723.15 |
+3.1% | $43805.66 |
| 2006 | $92332.68 | +3.5% | $49992.64 |
+3.5% | $42340.04 |
| Year | This Occupation | Compared to
All Occupations | Difference |
| Current | $109556.28 | | $56151.41 |
| $53404.87 |
| 2014 | $109023.59 | +.5% | $55693.41 |
+.8% | $53330.19 |
| 2013 | $106981.62 | +1.9% | $54502.59 |
+2.2% | $52479.03 |
| 2012 | $104939.65 | +1.9% | $53403.38 |
+2.1% | $51536.27 |
| 2011 | $102897.67 | +2.0% | $52487.37 |
+1.7% | $50410.30 |
| 2010 | $101299.61 | +1.6% | $51662.96 |
+1.6% | $49636.65 |
| 2009 | $99523.98 | +1.8% | $50792.75 |
+1.7% | $48731.23 |
| 2008 | $98458.60 | +1.1% | $50105.74 |
+1.4% | $48352.86 |
| 2007 | $95528.81 | +3.1% | $48823.33 |
+2.6% | $46705.48 |
| 2006 | $92332.68 | +3.5% | $47266.11 |
+3.3% | $45066.57 |
|
Reference Date: 1st Quarter 2015 |
State of Connecticut Department of Labor Office of Research
200 Folly Brook Boulevard Wethersfield, CT 06109
Phone: 860-263-6285 |

| | | | |
| Top Areas For This Occupation |
|
|
|
 |


