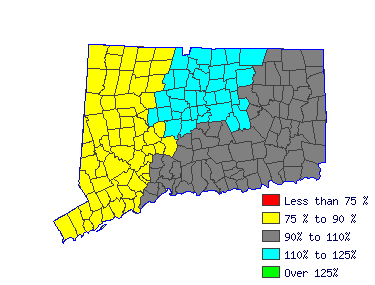
| Mean Wage History |
| Year | This Occupation | Compared to
Occupational Group | Difference |
| Current | $88273.08 | | $55638.49 |
| $32634.59 |
| 2014 | $87843.88 | +.5% | $55367.96 |
+.5% | $32475.91 |
| 2013 | $86198.59 | +1.9% | $54330.94 |
+1.9% | $31867.65 |
| 2012 | $84553.31 | +1.9% | $53293.92 |
+1.9% | $31259.39 |
| 2011 | $82908.02 | +2.0% | $52256.90 |
+2.0% | $30651.13 |
| 2010 | $81620.41 | +1.6% | $51445.31 |
+1.6% | $30175.09 |
| 2009 | $80189.73 | +1.8% | $50543.56 |
+1.8% | $29646.17 |
| 2008 | $79331.32 | +1.1% | $50002.50 |
+1.1% | $29328.82 |
| 2007 | $76970.69 | +3.1% | $48514.60 |
+3.1% | $28456.09 |
| 2006 | $74395.46 | +3.5% | $46891.43 |
+3.5% | $27504.03 |
| Year | This Occupation | Compared to
All Occupations | Difference |
| Current | $88273.08 | | $51120.02 |
| $37153.06 |
| 2014 | $87843.88 | +.5% | $50703.05 |
+.8% | $37140.82 |
| 2013 | $86198.59 | +1.9% | $49618.94 |
+2.2% | $36579.65 |
| 2012 | $84553.31 | +1.9% | $48618.22 |
+2.1% | $35935.08 |
| 2011 | $82908.02 | +2.0% | $47784.29 |
+1.7% | $35123.73 |
| 2010 | $81620.41 | +1.6% | $47033.75 |
+1.6% | $34586.65 |
| 2009 | $80189.73 | +1.8% | $46241.52 |
+1.7% | $33948.21 |
| 2008 | $79331.32 | +1.1% | $45616.07 |
+1.4% | $33715.25 |
| 2007 | $76970.69 | +3.1% | $44448.57 |
+2.6% | $32522.13 |
| 2006 | $74395.46 | +3.5% | $43030.88 |
+3.3% | $31364.58 |
|
Reference Date: 1st Quarter 2015 |
State of Connecticut Department of Labor Office of Research
200 Folly Brook Boulevard Wethersfield, CT 06109
Phone: 860-263-6285 |

| | | | |
| Top Areas For This Occupation |
|
|
|
 |


