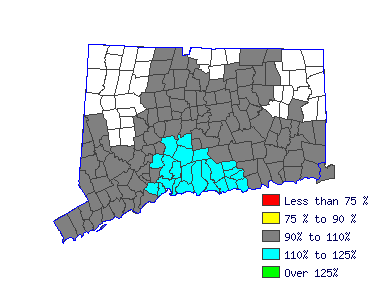
| Waterbury Labor Market Area (1Q 2015) |
| All Industry |
| Estimated employment | 150 |
| Mean wage | $69,376 |
| Entry wage | $54,592 |
| 10th percentile wage | $51,682 |
| 50th percentile wage | $65,573 |
| 90th percentile wage | $93,640 |
 | | Top Employing Industries |
| Industry | Employment | % |
| Education & Health Services | 150 | 100.3% |
 |
| Best Paying Industries |
| Industry | Employment | Median
Wage |
| Education & Health Services | 150 | 69,362 |
 | |
 |
| Kindergarten Teachers, Except Special Education (25-2012) |
| Teach elemental natural and social science, personal hygiene, music, art, and literature to children from 4 to 6 years old. Promote physical, mental, and social development. May be required to hold State certification. Exclude "Special Education Teachers" (25-2041 through 25-2043). |
| Mean Wage History |
| Year | This Occupation | Compared to
Occupational Group | Difference |
| Current | $69375.74 | | $57086.44 |
| $12289.30 | | 2014 | $69038.42 | +.5% | $56808.87 |
+.5% | $12229.55 | | 2013 | $67745.35 | +1.9% | $55744.86 |
+1.9% | $12000.49 | | 2012 | $66452.29 | +1.9% | $54680.85 |
+1.9% | $11771.44 | | 2011 | $65159.22 | +2.0% | $53616.84 |
+2.0% | $11542.38 | | 2010 | $64147.26 | +1.6% | $52784.14 |
+1.6% | $11363.12 | | 2009 | $63022.86 | +1.8% | $51858.91 |
+1.8% | $11163.94 | | 2008 | $62348.21 | +1.1% | $51303.78 |
+1.1% | $11044.44 | | 2007 | $60492.95 | +3.1% | $49777.16 |
+3.1% | $10715.79 | | 2006 | $58469.02 | +3.5% | $48111.75 |
+3.5% | $10357.27 |
| Year | This Occupation | Compared to
All Occupations | Difference |
| Current | $69375.74 | | $47062.91 |
| $22312.83 | | 2014 | $69038.42 | +.5% | $46679.04 |
+.8% | $22359.38 | | 2013 | $67745.35 | +1.9% | $45680.96 |
+2.2% | $22064.39 | | 2012 | $66452.29 | +1.9% | $44759.67 |
+2.1% | $21692.62 | | 2011 | $65159.22 | +2.0% | $43991.92 |
+1.7% | $21167.30 | | 2010 | $64147.26 | +1.6% | $43300.95 |
+1.6% | $20846.31 | | 2009 | $63022.86 | +1.8% | $42571.59 |
+1.7% | $20451.27 | | 2008 | $62348.21 | +1.1% | $41995.78 |
+1.4% | $20352.44 | | 2007 | $60492.95 | +3.1% | $40920.93 |
+2.6% | $19572.02 | | 2006 | $58469.02 | +3.5% | $39615.76 |
+3.3% | $18853.26 |
|
Reference Date: 1st Quarter 2015 |
State of Connecticut Department of Labor Office of Research
200 Folly Brook Boulevard Wethersfield, CT 06109
Phone: 860-263-6285 |

| | | | |
| Top Areas For This Occupation |
|
|
|
 |
|


