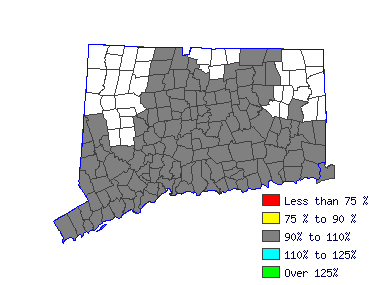
| New Haven Labor Market Area (1Q 2015) |
| All Industry |
| Estimated employment | 3,170 |
| Mean wage | 13.59 |
| Entry wage | 9.90 |
| 10th percentile wage | 9.27 |
| 50th percentile wage | 11.89 |
| 90th percentile wage | 20.45 |
 | | Top Employing Industries |
| Industry | Employment | % |
| Trade, Transportation & Utilities | 2,860 | 90.2% |
| Manufacturing | 150 | 4.6% |
| Professional & Business Services | 60 | 1.9% |
| Education & Health Services | 40 | 1.1% |
| Public Adminsitration | 20 | 0.5% |
 |
| Best Paying Industries |
| Industry | Employment | Median
Wage |
| Public Adminsitration | 20 | 21.80 |
| Education & Health Services | 40 | 16.16 |
| Manufacturing | 150 | 15.92 |
| Trade, Transportation & Utilities | 2,860 | 13.21 |
| Professional & Business Services | 60 | 13.21 |
 | |
 |
| Stock Clerks and Order Fillers (43-5081) |
| Receive, store, and issue sales floor merchandise, materials, equipment, and other items from stockroom, warehouse, or storage yard to fill shelves, racks, tables, or customers' orders. May mark prices on merchandise and set up sales displays. Exclude "Laborers and Freight, Stock, and Material Movers, Hand" (53-7062), and "Shipping, Receiving, and Traffic Clerks" (43-5071). |
| Mean Wage History |
| Year | This Occupation | Compared to
Occupational Group | Difference |
| Current | $13.59 | | $20.20 |
| -$6.61 | | 2014 | $13.50 | +.7% | $20.07 |
+.7% | -$6.56 | | 2013 | $13.24 | +2.0% | $19.68 |
+2.0% | -$6.43 | | 2012 | $12.97 | +2.0% | $19.28 |
+2.0% | -$6.30 | | 2011 | $12.75 | +1.7% | $18.95 |
+1.7% | -$6.20 | | 2010 | $12.52 | +1.8% | $18.61 |
+1.8% | -$6.08 | | 2009 | $12.32 | +1.6% | $18.32 |
+1.6% | -$5.99 | | 2008 | $12.09 | +1.9% | $17.97 |
+1.9% | -$5.88 | | 2007 | $11.76 | +2.8% | $17.48 |
+2.8% | -$5.72 | | 2006 | $11.39 | +3.3% | $16.92 |
+3.3% | -$5.53 |
| Year | This Occupation | Compared to
All Occupations | Difference |
| Current | $13.59 | | $26.14 |
| -$12.55 | | 2014 | $13.50 | +.7% | $25.93 |
+.8% | -$12.42 | | 2013 | $13.24 | +2.0% | $25.37 |
+2.2% | -$12.13 | | 2012 | $12.97 | +2.0% | $24.86 |
+2.1% | -$11.88 | | 2011 | $12.75 | +1.7% | $24.43 |
+1.7% | -$11.68 | | 2010 | $12.52 | +1.8% | $24.05 |
+1.6% | -$11.52 | | 2009 | $12.32 | +1.6% | $23.65 |
+1.7% | -$11.32 | | 2008 | $12.09 | +1.9% | $23.33 |
+1.4% | -$11.23 | | 2007 | $11.76 | +2.8% | $22.73 |
+2.6% | -$10.96 | | 2006 | $11.39 | +3.3% | $22.00 |
+3.3% | -$10.61 |
|
Reference Date: 1st Quarter 2015 |
State of Connecticut Department of Labor Office of Research
200 Folly Brook Boulevard Wethersfield, CT 06109
Phone: 860-263-6285 |

| | | | |
| Top Areas For This Occupation |
|
|
|
 |
|


