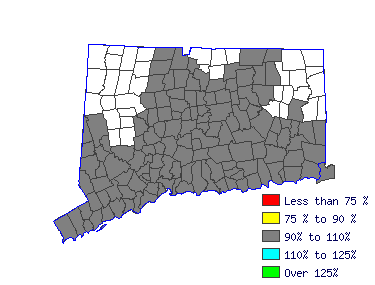
| Mean Wage History |
| Year | This Occupation | Compared to
Occupational Group | Difference |
| Current | $71069.07 | | $53517.27 |
| $17551.80 |
| 2014 | $70723.52 | +.5% | $53257.06 |
+.5% | $17466.46 |
| 2013 | $69398.89 | +1.9% | $52259.57 |
+1.9% | $17139.32 |
| 2012 | $68074.26 | +1.9% | $51262.09 |
+1.9% | $16812.18 |
| 2011 | $66749.64 | +2.0% | $50264.60 |
+2.0% | $16485.04 |
| 2010 | $65712.97 | +1.6% | $49483.96 |
+1.6% | $16229.01 |
| 2009 | $64561.12 | +1.8% | $48616.58 |
+1.8% | $15944.54 |
| 2008 | $63870.02 | +1.1% | $48096.15 |
+1.1% | $15773.86 |
| 2007 | $61969.46 | +3.1% | $46664.98 |
+3.1% | $15304.49 |
| 2006 | $59896.14 | +3.5% | $45103.70 |
+3.5% | $14792.44 |
| Year | This Occupation | Compared to
All Occupations | Difference |
| Current | $71069.07 | | $51791.62 |
| $19277.45 |
| 2014 | $70723.52 | +.5% | $51369.18 |
+.8% | $19354.34 |
| 2013 | $69398.89 | +1.9% | $50270.82 |
+2.2% | $19128.07 |
| 2012 | $68074.26 | +1.9% | $49256.96 |
+2.1% | $18817.31 |
| 2011 | $66749.64 | +2.0% | $48412.07 |
+1.7% | $18337.57 |
| 2010 | $65712.97 | +1.6% | $47651.67 |
+1.6% | $18061.30 |
| 2009 | $64561.12 | +1.8% | $46849.03 |
+1.7% | $17712.10 |
| 2008 | $63870.02 | +1.1% | $46215.36 |
+1.4% | $17654.65 |
| 2007 | $61969.46 | +3.1% | $45032.52 |
+2.6% | $16936.95 |
| 2006 | $59896.14 | +3.5% | $43596.21 |
+3.3% | $16299.93 |
|
Reference Date: 1st Quarter 2015 |
State of Connecticut Department of Labor Office of Research
200 Folly Brook Boulevard Wethersfield, CT 06109
Phone: 860-263-6285 |

| | | | |
| Top Areas For This Occupation |
|
|
|
 |


