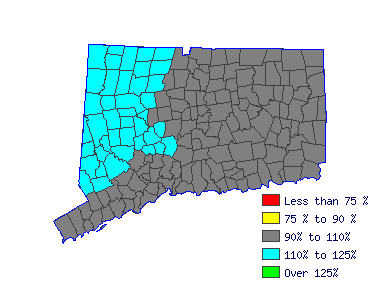
| Southwest WDA (1Q 2016) |
| All Industry |
| Estimated employment | N/A |
| Mean wage | $74,931 |
| Entry wage | $57,049 |
| 10th percentile wage | $54,936 |
| 50th percentile wage | $74,709 |
| 90th percentile wage | $98,760 |
 | | Top Employing Industries |
| Industry | Employment / Percent |
| Education and Health Services | | |
 |
| Top Paying Industries |
| Industry | Employment / Median Wage |
| Education and Health Services | | $74,709 |
 | |
 |
| Career/Technical Education Teachers, Secondary School (25-2032) |
| Teach occupational, career and technical, or vocational subjects at the secondary school level in public or private schools. Substitute teachers are included in ""Teachers and Instructors, All Other"" (25-3099). Excludes ""Special Education Teachers, S |
 |
| Mean Wage History |
| Year | This
Occupation | Compared to
Occupational Group | Difference |
| Current | $74709.28 | | $61639.57 |
| $13069.71 | | 2015 | $72811.90 | +2.6% | $60074.12 |
+2.6% | $12737.78 | | 2014 | $71448.16 | +1.9% | $58948.95 |
+1.9% | $12499.21 | | 2013 | $70084.42 | +1.9% | $57823.79 |
+1.9% | $12260.63 | | 2012 | $68720.68 | +2.0% | $56698.62 |
+2.0% | $12022.06 | | 2011 | $67653.40 | +1.6% | $55818.06 |
+1.6% | $11835.35 | | 2010 | $66467.54 | +1.8% | $54839.65 |
+1.8% | $11627.89 | | 2009 | $65756.03 | +1.1% | $54252.61 |
+1.1% | $11503.42 | | 2008 | $63799.35 | +3.1% | $52638.24 |
+3.1% | $11161.12 | | 2007 | $61664.80 | +3.5% | $50877.11 |
+3.5% | $10787.70 |
| Year | This
Occupation | Compared to
All Occupations | Difference |
| Current | $74709.28 | | $48577.28 |
| $26132.00 | | 2015 | $72811.90 | +2.6% | $47218.20 |
+2.9% | $25593.70 | | 2014 | $71448.16 | +1.9% | $46208.60 |
+2.2% | $25239.56 | | 2013 | $70084.42 | +1.9% | $45276.67 |
+2.1% | $24807.75 | | 2012 | $68720.68 | +2.0% | $44500.05 |
+1.7% | $24220.63 | | 2011 | $67653.40 | +1.6% | $43801.10 |
+1.6% | $23852.31 | | 2010 | $66467.54 | +1.8% | $43063.31 |
+1.7% | $23404.23 | | 2009 | $65756.03 | +1.1% | $42480.85 |
+1.4% | $23275.17 | | 2008 | $63799.35 | +3.1% | $41393.59 |
+2.6% | $22405.76 | | 2007 | $61664.80 | +3.5% | $40073.34 |
+3.3% | $21591.46 |
 |
|
| Reference Date: 1st Quarter 2016 |
| Top Areas For This Occupation |
|
|
|

| |


