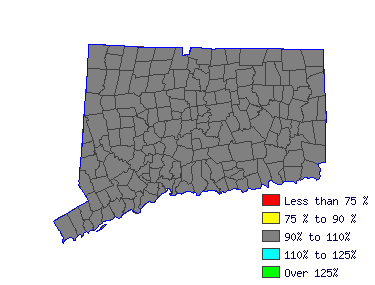
| Northwest WDA (1Q 2016) |
| All Industry |
| Estimated employment | 270 |
| Mean wage | $80,559 |
| Entry wage | $63,468 |
| 10th percentile wage | $58,023 |
| 50th percentile wage | $82,895 |
| 90th percentile wage | $101,653 |
 | | Top Employing Industries |
| Industry | Employment / Percent |
| Education and Health Services | 260 | 96.6% |
 |
| Top Paying Industries |
| Industry | Employment / Median Wage |
| Education and Health Services | 260 | $83,160 |
 | |
 |
| Career/Technical Education Teachers, Secondary School (25-2032) |
| Teach occupational, career and technical, or vocational subjects at the secondary school level in public or private schools. Substitute teachers are included in ""Teachers and Instructors, All Other"" (25-3099). Excludes ""Special Education Teachers, S |
 |
| Mean Wage History |
| Year | This
Occupation | Compared to
Occupational Group | Difference |
| Current | $82895.22 | | $56388.55 |
| $26506.67 | | 2015 | $80789.94 | +2.6% | $54956.46 |
+2.6% | $25833.48 | | 2014 | $79276.78 | +1.9% | $53927.15 |
+1.9% | $25349.63 | | 2013 | $77763.61 | +1.9% | $52897.83 |
+1.9% | $24865.78 | | 2012 | $76250.44 | +2.0% | $51868.52 |
+2.0% | $24381.93 | | 2011 | $75066.23 | +1.6% | $51062.96 |
+1.6% | $24003.26 | | 2010 | $73750.43 | +1.8% | $50167.91 |
+1.8% | $23582.52 | | 2009 | $72960.95 | +1.1% | $49630.87 |
+1.1% | $23330.08 | | 2008 | $70789.89 | +3.1% | $48154.03 |
+3.1% | $22635.85 | | 2007 | $68421.45 | +3.5% | $46542.93 |
+3.5% | $21878.52 |
| Year | This
Occupation | Compared to
All Occupations | Difference |
| Current | $82895.22 | | $40188.76 |
| $42706.46 | | 2015 | $80789.94 | +2.6% | $39064.37 |
+2.9% | $41725.57 | | 2014 | $79276.78 | +1.9% | $38229.12 |
+2.2% | $41047.66 | | 2013 | $77763.61 | +1.9% | $37458.11 |
+2.1% | $40305.50 | | 2012 | $76250.44 | +2.0% | $36815.60 |
+1.7% | $39434.84 | | 2011 | $75066.23 | +1.6% | $36237.35 |
+1.6% | $38828.88 | | 2010 | $73750.43 | +1.8% | $35626.97 |
+1.7% | $38123.46 | | 2009 | $72960.95 | +1.1% | $35145.09 |
+1.4% | $37815.86 | | 2008 | $70789.89 | +3.1% | $34245.58 |
+2.6% | $36544.31 | | 2007 | $68421.45 | +3.5% | $33153.32 |
+3.3% | $35268.13 |
 |
|
| Reference Date: 1st Quarter 2016 |
| Top Areas For This Occupation |
|
|
|

| |


