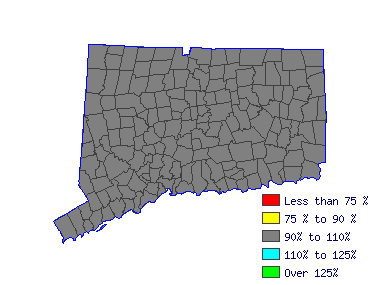
| Mean Wage History |
| Year | This Occupation | Compared to
Occupational Group | Difference |
| Current | $74534.82 | | $59890.07 |
| $14644.75 |
| 2014 | $74172.41 | +.5% | $59598.87 |
+.5% | $14573.54 |
| 2013 | $72783.19 | +1.9% | $58482.60 |
+1.9% | $14300.59 |
| 2012 | $71393.97 | +1.9% | $57366.34 |
+1.9% | $14027.63 |
| 2011 | $70004.75 | +2.0% | $56250.07 |
+2.0% | $13754.67 |
| 2010 | $68917.53 | +1.6% | $55376.47 |
+1.6% | $13541.05 |
| 2009 | $67709.51 | +1.8% | $54405.81 |
+1.8% | $13303.70 |
| 2008 | $66984.70 | +1.1% | $53823.41 |
+1.1% | $13161.29 |
| 2007 | $64991.46 | +3.1% | $52221.81 |
+3.1% | $12769.65 |
| 2006 | $62817.03 | +3.5% | $50474.61 |
+3.5% | $12342.41 |
| Year | This Occupation | Compared to
All Occupations | Difference |
| Current | $74534.82 | | $63821.30 |
| $10713.52 |
| 2014 | $74172.41 | +.5% | $63300.73 |
+.8% | $10871.68 |
| 2013 | $72783.19 | +1.9% | $61947.27 |
+2.2% | $10835.93 |
| 2012 | $71393.97 | +1.9% | $60697.91 |
+2.1% | $10696.06 |
| 2011 | $70004.75 | +2.0% | $59656.78 |
+1.7% | $10347.97 |
| 2010 | $68917.53 | +1.6% | $58719.76 |
+1.6% | $10197.77 |
| 2009 | $67709.51 | +1.8% | $57730.69 |
+1.7% | $9978.82 |
| 2008 | $66984.70 | +1.1% | $56949.84 |
+1.4% | $10034.86 |
| 2007 | $64991.46 | +3.1% | $55492.26 |
+2.6% | $9499.21 |
| 2006 | $62817.03 | +3.5% | $53722.33 |
+3.3% | $9094.69 |
|
Reference Date: 1st Quarter 2015 |
State of Connecticut Department of Labor Office of Research
200 Folly Brook Boulevard Wethersfield, CT 06109
Phone: 860-263-6285 |

| | | | |
| Top Areas For This Occupation |
|
|
|
 |


