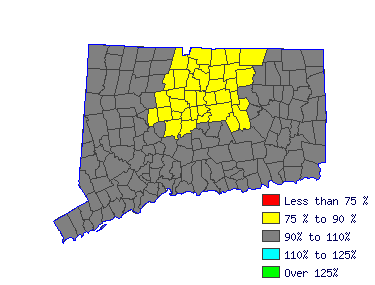
| Mean Wage History |
| Year | This Occupation | Compared to
Occupational Group | Difference |
| Current | $13.22 | | $14.31 |
| -$1.09 |
| 2014 | $13.12 | +.7% | $14.20 |
+.7% | -$1.08 |
| 2013 | $12.86 | +2.0% | $13.92 |
+2.0% | -$1.06 |
| 2012 | $12.70 | +1.3% | $13.75 |
+1.3% | -$1.04 |
| 2011 | $12.51 | +1.5% | $13.55 |
+1.5% | -$1.03 |
| 2010 | $12.34 | +1.4% | $13.36 |
+1.4% | -$1.01 |
| 2009 | $12.21 | +1.1% | $13.22 |
+1.1% | -$1.00 |
| 2008 | $11.97 | +2.0% | $12.96 |
+2.0% | -$0.98 |
| 2007 | $11.64 | +2.8% | $12.60 |
+2.8% | -$0.96 |
| 2006 | $11.19 | +4.1% | $12.11 |
+4.1% | -$0.92 |
| Year | This Occupation | Compared to
All Occupations | Difference |
| Current | $13.22 | | $25.99 |
| -$12.77 |
| 2014 | $13.12 | +.7% | $25.78 |
+.8% | -$12.65 |
| 2013 | $12.86 | +2.0% | $25.23 |
+2.2% | -$12.36 |
| 2012 | $12.70 | +1.3% | $24.72 |
+2.1% | -$12.01 |
| 2011 | $12.51 | +1.5% | $24.29 |
+1.7% | -$11.78 |
| 2010 | $12.34 | +1.4% | $23.91 |
+1.6% | -$11.57 |
| 2009 | $12.21 | +1.1% | $23.51 |
+1.7% | -$11.30 |
| 2008 | $11.97 | +2.0% | $23.19 |
+1.4% | -$11.22 |
| 2007 | $11.64 | +2.8% | $22.60 |
+2.6% | -$10.95 |
| 2006 | $11.19 | +4.1% | $21.88 |
+3.3% | -$10.69 |
|
Reference Date: 1st Quarter 2015 |
State of Connecticut Department of Labor Office of Research
200 Folly Brook Boulevard Wethersfield, CT 06109
Phone: 860-263-6285 |

| | | | |
| Top Areas For This Occupation |
|
|
|
 |


