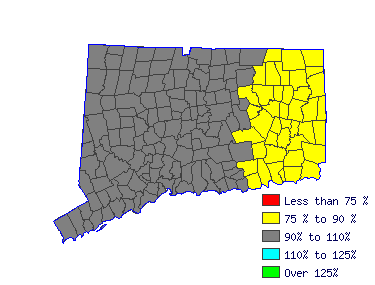
| South Central Workforce Investment Area (1Q 2015) |
| All Industry |
| Estimated employment | 2,270 |
| Mean wage | 16.49 |
| Entry wage | 12.11 |
| 10th percentile wage | 11.02 |
| 50th percentile wage | 15.10 |
| 90th percentile wage | 24.43 |
 | | Top Employing Industries |
| Industry | Employment | % |
| Professional & Business Services | 1,360 | 60.0% |
| Leisure and Hospitality | 230 | 10.2% |
| Education & Health Services | 220 | 9.6% |
| Public Adminsitration | 120 | 5.3% |
| Trade, Transportation & Utilities | 110 | 4.7% |
 |
| Best Paying Industries |
| Industry | Employment | Median
Wage |
| Trade, Transportation & Utilities | 110 | 20.08 |
| Public Adminsitration | 120 | 18.79 |
| Education & Health Services | 220 | 18.37 |
| Professional & Business Services | 1,360 | 16.05 |
| Leisure and Hospitality | 230 | 15.85 |
 | |
 |
| Landscaping and Groundskeeping Workers (37-3011) |
| Landscape or maintain grounds of property using hand or power tools or equipment. Workers typically perform a variety of tasks, which may include any combination of the following: sod laying, mowing, trimming, planting, watering, fertilizing, digging, raking, sprinkler installation, and installation of mortarless segmental concrete masonry wall units. Exclude "Farmworkers and Laborers, Crop, Nursery, and Greenhouse" (45-2092). |
| Mean Wage History |
| Year | This Occupation | Compared to
Occupational Group | Difference |
| Current | $16.49 | | $15.53 |
| $0.96 | | 2014 | $16.37 | +.7% | $15.42 |
+.7% | $0.95 | | 2013 | $16.04 | +2.0% | $15.11 |
+2.0% | $0.93 | | 2012 | $15.84 | +1.3% | $14.92 |
+1.3% | $0.92 | | 2011 | $15.61 | +1.5% | $14.70 |
+1.5% | $0.91 | | 2010 | $15.39 | +1.4% | $14.50 |
+1.4% | $0.90 | | 2009 | $15.23 | +1.1% | $14.34 |
+1.1% | $0.89 | | 2008 | $14.93 | +2.0% | $14.06 |
+2.0% | $0.87 | | 2007 | $14.52 | +2.8% | $13.68 |
+2.8% | $0.85 | | 2006 | $13.95 | +4.1% | $13.14 |
+4.1% | $0.81 |
| Year | This Occupation | Compared to
All Occupations | Difference |
| Current | $16.49 | | $25.99 |
| -$9.50 | | 2014 | $16.37 | +.7% | $25.78 |
+.8% | -$9.41 | | 2013 | $16.04 | +2.0% | $25.23 |
+2.2% | -$9.18 | | 2012 | $15.84 | +1.3% | $24.72 |
+2.1% | -$8.87 | | 2011 | $15.61 | +1.5% | $24.29 |
+1.7% | -$8.68 | | 2010 | $15.39 | +1.4% | $23.91 |
+1.6% | -$8.52 | | 2009 | $15.23 | +1.1% | $23.51 |
+1.7% | -$8.28 | | 2008 | $14.93 | +2.0% | $23.19 |
+1.4% | -$8.26 | | 2007 | $14.52 | +2.8% | $22.60 |
+2.6% | -$8.07 | | 2006 | $13.95 | +4.1% | $21.88 |
+3.3% | -$7.92 |
|
Reference Date: 1st Quarter 2015 |
State of Connecticut Department of Labor Office of Research
200 Folly Brook Boulevard Wethersfield, CT 06109
Phone: 860-263-6285 |

| | | | |
| Top Areas For This Occupation |
|
|
|
 |
|


